Category Archives: Surveys

U.S. Lifestyle Rankings: The Best Places To Live In 2022

The 10 Best Places to Live in the U.S. in 2022-2023:

1. Huntsville, Alabama
2. Colorado Springs, Colorado
3. Green Bay, Wisconsin
4. Boulder, Colorado
5. San Jose, California
6. Raleigh and Durham, North Carolina
7. Fayetteville, Arkansas
8. Portland, Maine
9. Sarasota, Florida
10. San Francisco

Housing costs are rising fast and there aren’t enough homes on the market nationwide to meet demand, and anyone looking to move is acutely aware of the competition and high cost to buy or rent a home. The Best Places to Live rankings factor in how the cost of living compares to the area’s median household income, but U.S. News & World Report also broke out the data into its own ranking.

Travel Study: Barcelona Is The Best City In The World

Barcelona

“Barcelona combines everything that is most charming about Mediterranean cities – a relaxed pace, months of endless sunshine, unbeatable food – with the cultural and design clout of almost any city in the cold north.”

SALLY DAVIES, TELEGRAPH DESTINATION EXPERT

DINING & HOTELS


36/50

CULTURE & HISTORY


31/50

OUTDOOR ACTIVITIES


35/50

TRANSPORT & GETTING THERE


43/50

U.S. Rankings: Best Places To Retire In 2022 – U.S. News

Infographic: Top Ten ‘Happiest Countries’

Healthcare: Older Adults Prefer Convenience Over Reputation In Physicians

A new study by a team from the University of Michigan Institute for Healthcare Policy and Innovation shows that adults over age 50 place more importance on convenience-related factors, rather than reputation, when choosing a doctor.

The study, based on data from IHPI’s National Poll on Healthy Aging supported by AARP and Michigan Medicine, still shows that online ratings and reviews of physicians play an important role, and should receive attention from providers and policymakers.

Dr. Jeffrey Kullgren, a U-M primary care physician and lead author of the study, describes the findings.

New Survey: 58% Of Older Adults Are ‘Likely’ To Get A Covid-19 Vaccine (Nov ’20)

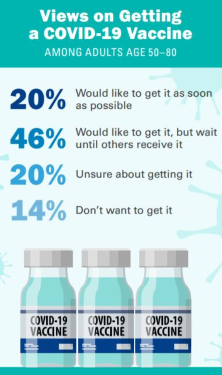
When asked how likely they would be to get a COVID-19 vaccine when available and if no cost to them, 58% of older adults indicated they would be likely to get a COVID-19 vaccine (33% very likely, 25% somewhat likely), 28% said they were unlikely (11% somewhat unlikely, 17% very unlikely), and 14% were unsure or did not know.

About two in three older adults (63%) indicated they received a flu shot last flu season. Seven in ten either received one since August 2020 (34%) or intended to get one this flu season (38%). Nearly half of adults age 50–80 (49%) believed that getting a flu vaccine is more important this year compared to other years, 44% said it is just as important, and 7% said it was less important.

Interest in getting a COVID-19 vaccine was more common among those age 65–80 compared with those 50–64 (63% vs. 54%), men compared with women (64% vs. 52%), and Whites compared with Hispanics and Blacks (63% vs. 51% vs. 40%). Individuals who lived with others, had higher household incomes, or had more education were also more likely to report they would get a COVID vaccine.

Half of adults age 50–80 (52%) said they personally knew someone who had COVID-19, and 2% reported having had it themselves. One in five older adults (19%) indicated they personally knew someone who died from COVID-19. The likelihood of getting a COVID-19 vaccine did not differ based on whether respondents knew someone who had COVID-19 or who died from it.

In deciding whether to get a COVID-19 vaccine, older adults rated the following as very important: how well it works (80%), their own research (56%), and if it was recommended by their doctor (52%), public health officials (42%), or family and friends (13%). Cost was rated as very important by 30% of older adults.

Website

Infographics: The Major Challenges Restaurants Face Post Covid-19 (2020)

Restaurants must function at 75% capacity in order to achieve profitability. With many restaurants operating at 50% capacity or less, how do they make up the remaining 25%? The three main contributing factors are contactless dining, labor optimization and changing the customer journey. Learn more about how restaurants are recovering during the COVID-19 pandemic in this infographic by OneDine.

Infographics: “Experience With Ageism” For Adults Age 50 – 80 (July 2020)

National Poll On Healthy Aging - University of Michigan

What is everyday ageism and how common is it?

This poll examined older adults’ experiences with nine forms of everyday ageism. These forms were categorized into three groups: (1) exposure to ageist messages, (2) ageism in interpersonal interactions, and (3) internalized ageism (personally held beliefs
about aging and older people).

Experiences With Everyday Ageism - Adults 50-80 - University of Michigan Healthy Aging

Website