Tag Archives: Polls

Aging: 34% Of The Elderly Feel ‘Socially Isolated’

Changes in feelings of social isolation, 2018-2023

In 2023, one in three adults age 50–80 (34%) reported feeling isolated from others (29% some of the time, 5% often) in the past year. This represents a marked decline compared with the 56% (43% some of the time, 13% often) who felt isolated in 2020, but a greater proportion than the 27% (22% some of the time, 5% often) who reported feeling isolated in 2018.

National Poll On Healthy Aging (March 2023) – More than one in three older adults (37%) reported feeling a lack of companionship (29% some of the time, 8% often) in the past year, compared with 41% (32% some of the time, 9% often) in 2020, and 34% (26% some of the time, 8% often) in 2018.

One in three older adults (33%) reported infrequent contact (once a week or less) with people from outside their home in 2023 (14% once a week, 10% every 2–3 weeks, 9% once a month or less). This rate of infrequent contact was significantly less than the 46% reported in 2020 (19% once a week, 11% every 2–3 weeks, 16% once a month or less), but higher than the 28% reported in 2018 (15% once a week, 7% every 2–3 weeks, 6% once a month or less).

READ MORE

New Survey: 58% Of Older Adults Are ‘Likely’ To Get A Covid-19 Vaccine (Nov ’20)

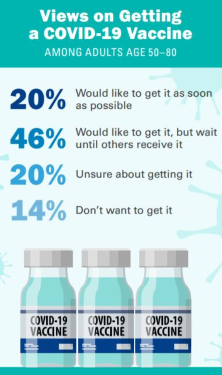
When asked how likely they would be to get a COVID-19 vaccine when available and if no cost to them, 58% of older adults indicated they would be likely to get a COVID-19 vaccine (33% very likely, 25% somewhat likely), 28% said they were unlikely (11% somewhat unlikely, 17% very unlikely), and 14% were unsure or did not know.

About two in three older adults (63%) indicated they received a flu shot last flu season. Seven in ten either received one since August 2020 (34%) or intended to get one this flu season (38%). Nearly half of adults age 50–80 (49%) believed that getting a flu vaccine is more important this year compared to other years, 44% said it is just as important, and 7% said it was less important.

Interest in getting a COVID-19 vaccine was more common among those age 65–80 compared with those 50–64 (63% vs. 54%), men compared with women (64% vs. 52%), and Whites compared with Hispanics and Blacks (63% vs. 51% vs. 40%). Individuals who lived with others, had higher household incomes, or had more education were also more likely to report they would get a COVID vaccine.

Half of adults age 50–80 (52%) said they personally knew someone who had COVID-19, and 2% reported having had it themselves. One in five older adults (19%) indicated they personally knew someone who died from COVID-19. The likelihood of getting a COVID-19 vaccine did not differ based on whether respondents knew someone who had COVID-19 or who died from it.

In deciding whether to get a COVID-19 vaccine, older adults rated the following as very important: how well it works (80%), their own research (56%), and if it was recommended by their doctor (52%), public health officials (42%), or family and friends (13%). Cost was rated as very important by 30% of older adults.

Website

Election Update: ‘Key Battleground States To Watch’ (WSJ Video)

Americans head to the polls after many states saw historic levels of early voting; the battleground states that will likely decide the next president; when to expect election results. WSJ’s Shelby Holliday has the latest election update.

Photo: Joe Raedle/Getty Images

Political Investigations: ‘What Pollsters Learned From 2016’ (WSJ Video)

In 2016, problems with state-level election polls left some voters surprised by the outcome. Since then, many pollsters have made changes in the hope of accurately capturing the mood of the country ahead of the 2020 election.

Photo illustration: Laura Kammermann

Infographics: “Experience With Ageism” For Adults Age 50 – 80 (July 2020)

National Poll On Healthy Aging - University of Michigan

What is everyday ageism and how common is it?

This poll examined older adults’ experiences with nine forms of everyday ageism. These forms were categorized into three groups: (1) exposure to ageist messages, (2) ageism in interpersonal interactions, and (3) internalized ageism (personally held beliefs
about aging and older people).

Experiences With Everyday Ageism - Adults 50-80 - University of Michigan Healthy Aging

Website

Survey: Most Americans “Feel Sleepy” 3+ Days Per Week, With Negative Impact On Daily Life (NSF)

National Sleep Foundation logo

Just 16 percent say they don’t feel sleepy at all in a typical week (this excludes sleepiness at bedtime and when waking up). About half, by contrast, feel sleepy anywhere from three to seven days a week. That includes a big gender gap: Women report feeling sleepy 3.4 days a week, on average; men, 2.7 days. 

Feeling Sleepy How Many Days A Week National Sleep Foundation Poll March 2020


Among the approximately three in 10 Americans who have feelings of sleepiness on five to seven days a week, 52 percent report often or sometimes experiencing irritability when sleepy; 40 percent, headaches; and 34 percent, feeling unwell apart from headaches. Each is far higher than among those with fewer experiences of sleepiness.

Health Impacts of Feeling Sleepy - 2020 Sleep Foundation Study March 2020

Read full study

Medical Care: 43% Of Older Adults Review Doctor Ratings Online

From a National Poll on Aging (Univ. of Michigan) online release:

National Poll on Healthy Aging University of Michigan January 6 2020 statistics
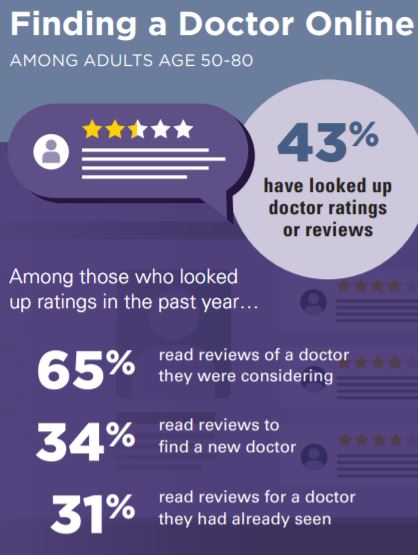
Among older adults age 50–80, 43% had ever reviewed doctor ratings; 14% had reviewed ratings more than once in the past year, 19% had done so once in the past year, and 10% had reviewed ratings more than one year ago.


Among older adults who had looked up doctor ratings within the past year, 65% read reviews of a doctor they were considering, 34% read reviews to find a new doctor, and 31% read reviews for a doctor they had already seen.

National Poll on Healthy Aging University of Michigan January 6 2020Ratings and reviews for nearly everything can be found online these days, including doctors. How are older adults using these ratings in their decisions about choosing doctors? In May 2019, the University of Michigan National Poll on Healthy Aging asked a
national sample of adults age 50–80 about their use and perceptions of online doctor ratings.


Read entire article