Tag Archives: Surveys

Healthcare: Older Adults Prefer Convenience Over Reputation In Physicians

A new study by a team from the University of Michigan Institute for Healthcare Policy and Innovation shows that adults over age 50 place more importance on convenience-related factors, rather than reputation, when choosing a doctor.

The study, based on data from IHPI’s National Poll on Healthy Aging supported by AARP and Michigan Medicine, still shows that online ratings and reviews of physicians play an important role, and should receive attention from providers and policymakers.

Dr. Jeffrey Kullgren, a U-M primary care physician and lead author of the study, describes the findings.

Advertisement

New Survey: 58% Of Older Adults Are ‘Likely’ To Get A Covid-19 Vaccine (Nov ’20)

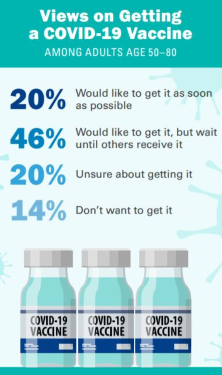
When asked how likely they would be to get a COVID-19 vaccine when available and if no cost to them, 58% of older adults indicated they would be likely to get a COVID-19 vaccine (33% very likely, 25% somewhat likely), 28% said they were unlikely (11% somewhat unlikely, 17% very unlikely), and 14% were unsure or did not know.

About two in three older adults (63%) indicated they received a flu shot last flu season. Seven in ten either received one since August 2020 (34%) or intended to get one this flu season (38%). Nearly half of adults age 50–80 (49%) believed that getting a flu vaccine is more important this year compared to other years, 44% said it is just as important, and 7% said it was less important.

Interest in getting a COVID-19 vaccine was more common among those age 65–80 compared with those 50–64 (63% vs. 54%), men compared with women (64% vs. 52%), and Whites compared with Hispanics and Blacks (63% vs. 51% vs. 40%). Individuals who lived with others, had higher household incomes, or had more education were also more likely to report they would get a COVID vaccine.

Half of adults age 50–80 (52%) said they personally knew someone who had COVID-19, and 2% reported having had it themselves. One in five older adults (19%) indicated they personally knew someone who died from COVID-19. The likelihood of getting a COVID-19 vaccine did not differ based on whether respondents knew someone who had COVID-19 or who died from it.

In deciding whether to get a COVID-19 vaccine, older adults rated the following as very important: how well it works (80%), their own research (56%), and if it was recommended by their doctor (52%), public health officials (42%), or family and friends (13%). Cost was rated as very important by 30% of older adults.

Website

Infographics: “Experience With Ageism” For Adults Age 50 – 80 (July 2020)

National Poll On Healthy Aging - University of Michigan

What is everyday ageism and how common is it?

This poll examined older adults’ experiences with nine forms of everyday ageism. These forms were categorized into three groups: (1) exposure to ageist messages, (2) ageism in interpersonal interactions, and (3) internalized ageism (personally held beliefs
about aging and older people).

Experiences With Everyday Ageism - Adults 50-80 - University of Michigan Healthy Aging

Website

Infographic: “Physicians Adopting Telemedicine”

Diagnostics World (June 30, 2020): The shift from face-to-face patient visits to remote medical appointments is a worldwide phenomenon, but most especially in the U.S., finds a recent global survey conducted by the doctors-only social networking platform Sermo. Unsurprisingly, Zoom tops the list of most-mentioned technologies. About one-fifth of surveyed doctors say they expect to be using telehealth tools “significantly” more post-pandemic than before COVID-19 upended business as usual.

Infographic - Telemedicine Adoption by Physicians - Sermo Survey June 2020

Website

Survey: Most Americans “Feel Sleepy” 3+ Days Per Week, With Negative Impact On Daily Life (NSF)

National Sleep Foundation logo

Just 16 percent say they don’t feel sleepy at all in a typical week (this excludes sleepiness at bedtime and when waking up). About half, by contrast, feel sleepy anywhere from three to seven days a week. That includes a big gender gap: Women report feeling sleepy 3.4 days a week, on average; men, 2.7 days. 

Feeling Sleepy How Many Days A Week National Sleep Foundation Poll March 2020


Among the approximately three in 10 Americans who have feelings of sleepiness on five to seven days a week, 52 percent report often or sometimes experiencing irritability when sleepy; 40 percent, headaches; and 34 percent, feeling unwell apart from headaches. Each is far higher than among those with fewer experiences of sleepiness.

Health Impacts of Feeling Sleepy - 2020 Sleep Foundation Study March 2020

Read full study

“2020 Philips Sleep Survey”: 50% Of People Sleep Poorly, With Decrease In Those Trying To Improve It

From a Philips “2020 Sleep Survey” online release (Mar 2, 2020):

Philips Global Sleep Survey 2020“The decrease in people taking action to improve sleep is alarming, especially when it is clear people around the world deeply value sleep. Sleep deficit impacts people both mentally and physically, so we need to educate people on available sleep resources and empower them with the confidence that their efforts will pay off,” said Mark Aloia, PhD, Global Lead for Behavior Change, Sleep & Respiratory Care at Philips.

2020-Philips-WSD-Report-page-3

Only 49% of people are satisfied with their sleep, with worry/stress reported as the most limiting factor to a good night’s sleep (33%). Interestingly, fewer people in 2020 are taking action to improve sleep compared to 2019, with nearly all listed strategies to improve sleep lower or consistent in 2020 when compared to 2019 results. For example, reading before bed was the most popular strategy used to improve sleep in 2019 (39%), but only 28% of people report reading to improve sleep in 2020. Other notable distinctions in sleep-related behavior appeared across age and gender differences.
.

Digital Health: Americans Open To 24/7 Monitoring Devices, AI Technology To Lower Health Care Costs

Center for the Digital Future at USC Annenberg (Feb 19, 2020):

Center for a Digital Future USC
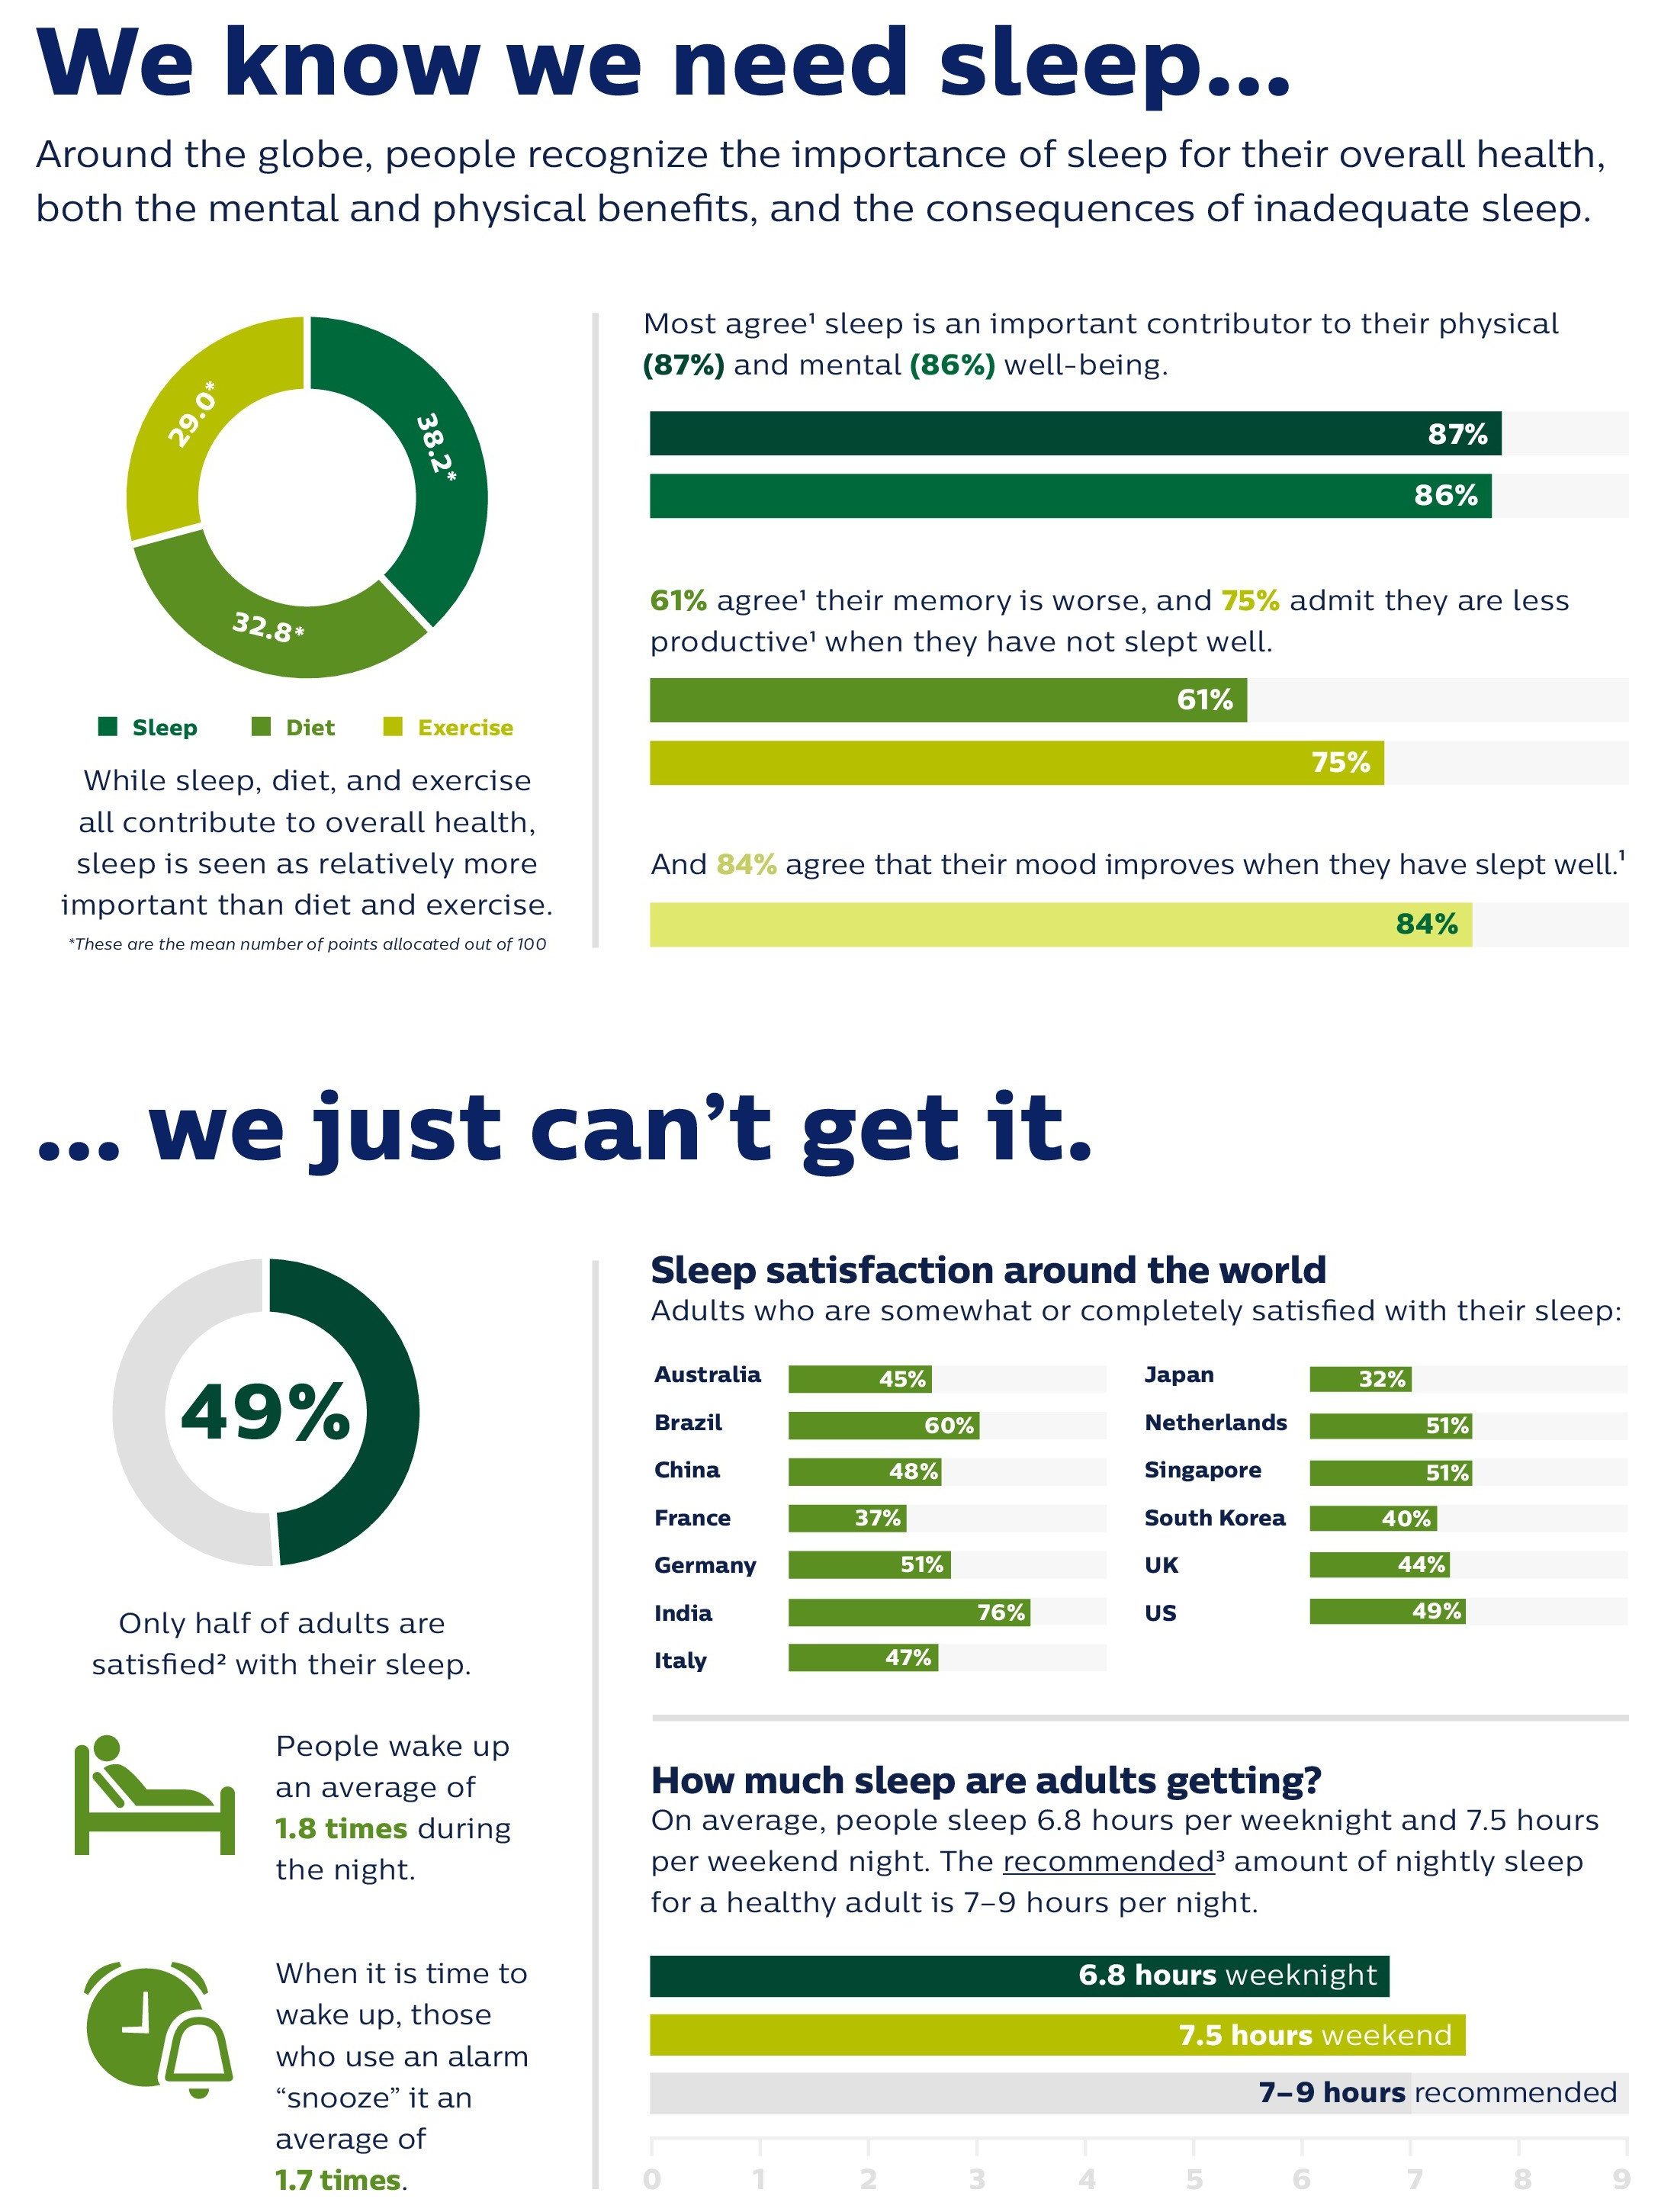
Many Americans are willing to make significant personal tradeoffs to lower their health insurance rates or medical costs, such as agreeing to 24/7 personal monitoring or working with artificial intelligence instead of a human doctor, the Center for the Digital Future at the USC Annenberg School for Communication and Journalism finds.

Among the study’s findings:

  • Nearly 1 in 4 Americans (24%) would work with an artificial intelligence-based technology if it lowered the cost of their health care.
  • Most Americans (80%) think that access to health care is a basic right that should be available to all citizens regardless of their ability to pay. This is a view shared even by a majority of citizens who identify themselves as very conservative (56%).
  • Significant percentages of Americans are willing to make profound lifestyle choices in exchange for lower insurance rates. For example, one-third of Americans would agree to 24/7 personal monitoring by insurance companies or health care professionals if their insurance rates were reduced.
  • Twenty-one percent of Americans said they would stay in their current job if leaving it meant losing their current health coverage.
  • Almost all Americans say health care is a key issue in the 2020 presidential election (92%).
  • Even though Americans say they are satisfied with their current health insurance, they are open to alternatives. Thirty percent of Americans would consider buying health coverage from any company that offers lower costs, including a variety of non-insurance companies such as Amazon, Google, or Costco.

Read more

Boomers & Technology: “2020 Tech And The 50+ Survey” (AARP – Dec 2019)

Tech ownership among older adults is growing with no signs of slowing down.

2020 Tech and The 50+ Survey AARP Wearable
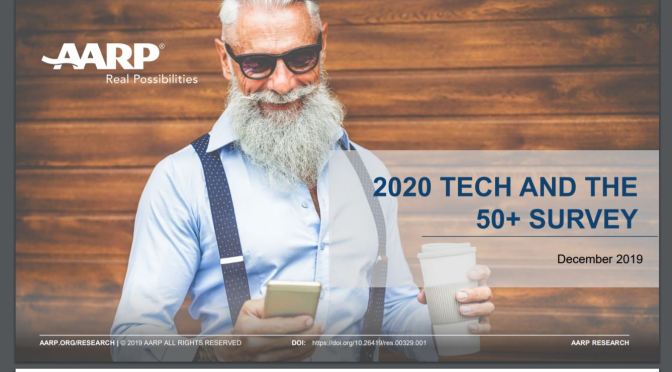
• For many devices, adoption among adults ages 50 and older is comparable to younger generations. Adults ages 50
and older are adopting smartphones, wearables, home assistants/smart speakers, and smart home technology at
nearly the same rate as adults ages 18–49.
• Younger adults have abandoned tablets, but older adults are adopting tablets at an increasing rate: More than half
(52%) of adults ages 50 and older own a tablet.
• Once adopted, usage of smartphones, wearables, tablets, home assistants/smart speakers, and smart home
technology is high with most owners using their technology daily.
While older adults are highly engaged with their devices, many are not using the technology to its full potential.
• Adults ages 50 and older are using smartphones and tablets to maintain social connections, find information, and for
entertainment, but only a few are using their device to automate their home or conduct transactions.
• Engaging in social media is one of the most common uses of a tech device (e.g., computer, tablet, or smartphone).
• Though 49% claim to own a smart TV, only 42% are using streaming or online options to watch shows.
• Nearly half (46%) of all smart home assistant/smart speaker owners do not use their device daily.

Read Report