Tag Archives: Reports

Reports: Tufts Health & Nutrition – August 2023

Tufts Health & Nutrition Letter (August 2023):

Beat the Heat with Cool Summer Treats

There’s nothing like an icy drink or frozen treat to help tame summer swelter, keep you hydrated, quench thirst, and satisfy a sweet tooth. Unfortunately, cool treats are often over-processed and packed with added sugars. Keep your cool with less processed, fruit-forward icy drinks and treats that are as healthy …


Issue Highlights

Reports: Tufts Health & Nutrition – July 2023 Issue

Image

Tufts Health & Nutrition Letter (July 2023): Food Allergy, or Intolerance?; Sugar substitute Erythritol associated with higher heart attack and stroke risks; Plant-based Cookouts; Create a Powerful Pantry, and more…

Food Allergy, or Intolerance?

These terms are often used interchangeably, but there are important differences.

Are You Losing Muscle?

We asked a leading expert what you can do to stay strong and active at any age.

Reports: Tufts Health & Nutrition – April 2023

Image

Tufts Health & Nutrition Letter (April 2023)

  • The Truth about “Brain-Boosting” Supplements
  • News Bites
  • Personalized Nutrition
  • Special Report: Cooking with Kids
  • Eight Cups of Water a Day?
  • Featured Recipe: April Fools’ Day Tofu Scramble
  • Ask Tufts Experts: Cardiovascular Disease; Melatonin

Reports: Tufts Health & Nutrition – March 2023

Contact Us - Tufts Health & Nutrition Letter

Tufts Health & Nutrition Letter (March 2023):

  • Obesity is a Disease: Why, and Why It Matters
  • News Bites
  • The Health Benefits of Strength Training
  • Special Report: Optimizing Sleep
  • Tummy Trouble: When to Seek Help
  • Featured Recipe: Cabbage Roll Casserole
  • Ask Tufts Experts: Vitamin C supplements; Processed Meats

Preview: Tufts Health & Nutrition, November 2022

Cover Image

Inside the Tufts Health & Nutrition Letter – November 2022:

  • Give Thanks for Good Health
  • Newsbites: Vitamin D; red meat and CVD risk; psyllium and constipation
  • Grain Products: Don’t be Fooled by Healthy-Sounding Labels!
  • Special Report: Top 3 Reasons to Avoid “Top Foods” Lists
  • Diet and Hemorrhoids
  • Featured Recipe: Fresh Cranberry Orange Relish
  • Ask Tufts Experts: Processed foods; calcium intake

Reports: Tufts Health & Nutrition – October 2022

Cover Image

For Brain Health, Protect Your Heart

Are Your Sleep Habits Affecting Your Weight?

Eight Essentials for Heart Health

Food Processing and Your Health: Balancing Benefits and Risks

News Bites October 2022

Foodscapes: Science Of The Global Food System

Health: “2020 National Diabetes Statistics Report”

CDC Centers for Disease Control and Prevention
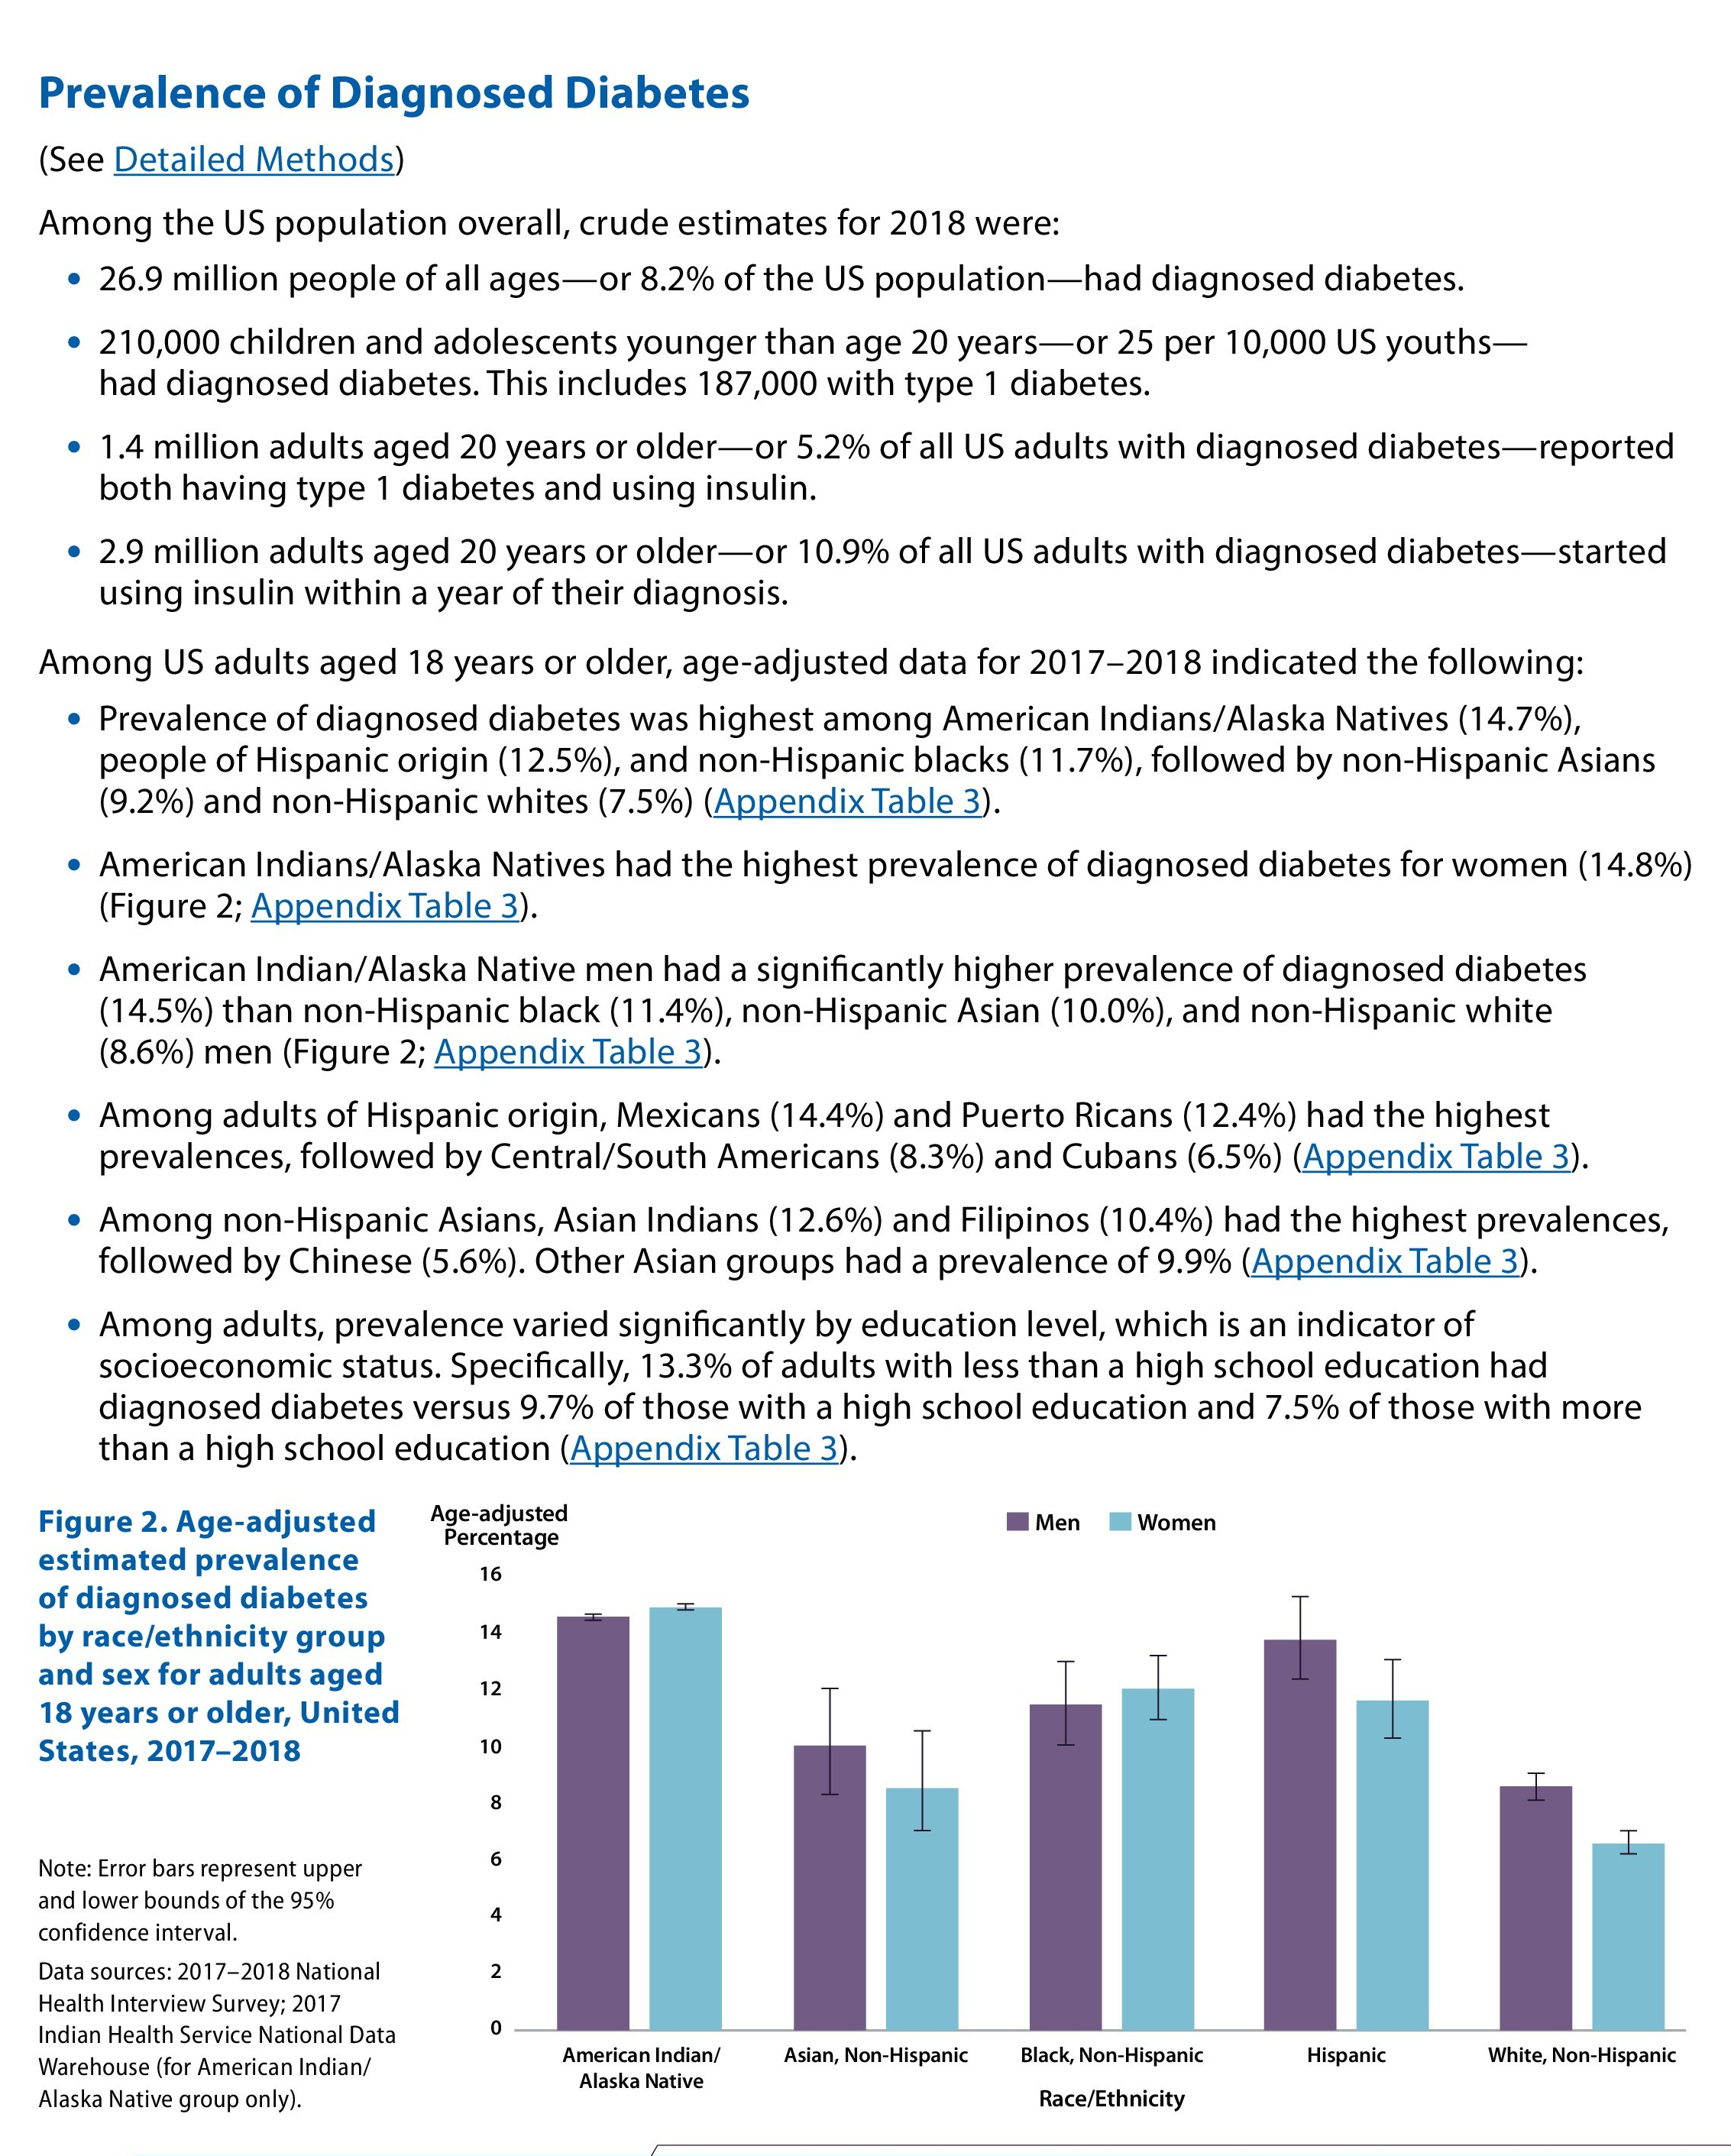
The National Diabetes Statistics Report is a periodic publication of the Centers for Disease Control and Prevention (CDC) that provides updated statistics about diabetes in the United States for a scientific audience. It includes information on prevalence and incidence of diabetes, prediabetes, risk factors for complications, acute and long-term complications, deaths, and costs. These data can help focus efforts to prevent and control diabetes across the United States.

national-diabetes-statistics-report-page-5


Healthcare: “2018 Health Care Cost Report” Shows Spending Grew 18% Per-Person From 2014 – 2018

HCCI Releases 2018 Health Care Cost and Utilization Report 

Per-Person Health Care Spending Grew 18% from 2014 to 2018, Driven Mostly by Prices

Health Care Cost Institute 2018 Health Care Cost and Utilization Report Cumulative Change in Spending per Person by Service Category


The report examines four groups of health care services and dozens of sub-categories. Of the four major categories, outpatient visits and procedures saw the highest 2018 spending increase (5.5%). Other notable trends include:

  • Inpatient services. 
    • Per-person spending on inpatient admissions rose 11.4% between 2014 and 2018
    • Within each sub-category of inpatient admissions, average prices grew steadily between 2014 and 2018 while utilization trends varied. However, the 2.0% price increase in 2018 was lower than the near 4% annual increases from 2014 to 2017.
  • Outpatient services.
    • ​Increases in prices and use led to a 16% increase in spending from 2014 to 2018.
    • ver that period, ER visit spending increased 32% and spending on observation stays went up 29%.
  • Professional services.
    • ​Spending increased 16% and growth accelerated over the 5-year period, driven by office visits and administered drugs.
    • Psychiatry also saw strikingly high spending growth of 43% from 2014 to 2018, which was driven mostly by increased use.
  • Prescription Drugs.
    • Generic drugs accounted for 88% of all prescriptions. .
    • Out-of-pocket payments for prescriptions for generic drugs was less than one-fifth of out-of-pocket payments on brand drugs.

Read full report