Tag Archives: Blood Pressure

Health: American Heart Association Updates Its ‘Optimal Checklist’ (2022)

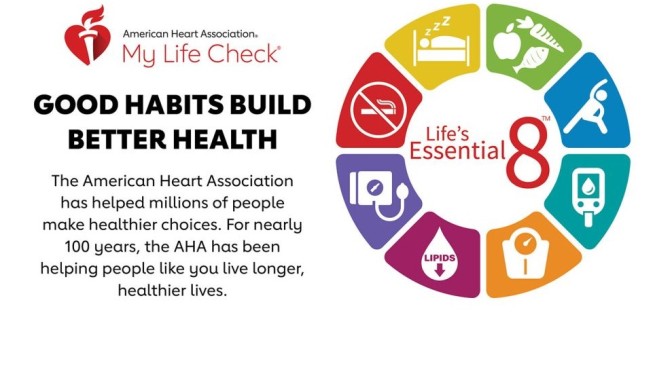
October 2022 – The American Heart Association (AHA) recently revised its checklist for achieving optimal heart health, introducing its new Life’s Essential 8. The list replaces the AHA’s decade-old Life’s Simple 7.

Sleep health is the new addition to the cardiovascular health scoring tool, which now advises that adults get seven to nine hours per night. The organization updated four of the categories:

  • Diet: More emphasis was given to following heart-healthy diets like the DASH and Mediterranean.
  • Nicotine exposure: Secondhand smoke and vaping were added as risk factors.
  • Blood lipids: People now can get a non-fasting blood sample that measures total, HDL, and non-HDL cholesterol. Non-HDL cholesterol can provide similar risk information as LDL cholesterol.
  • Blood sugar: Measurements now include hemoglobin A1c, a key component to assessing type 2 diabetes risk.
  • Three categories were unchanged:
  • Physical activity: The optimal weekly level is at least 150 minutes of moderate activity or 75 minutes of vigorous activity.
  • Body mass index (BMI): A BMI of 18.5 to 24.9 is ideal for heart health.
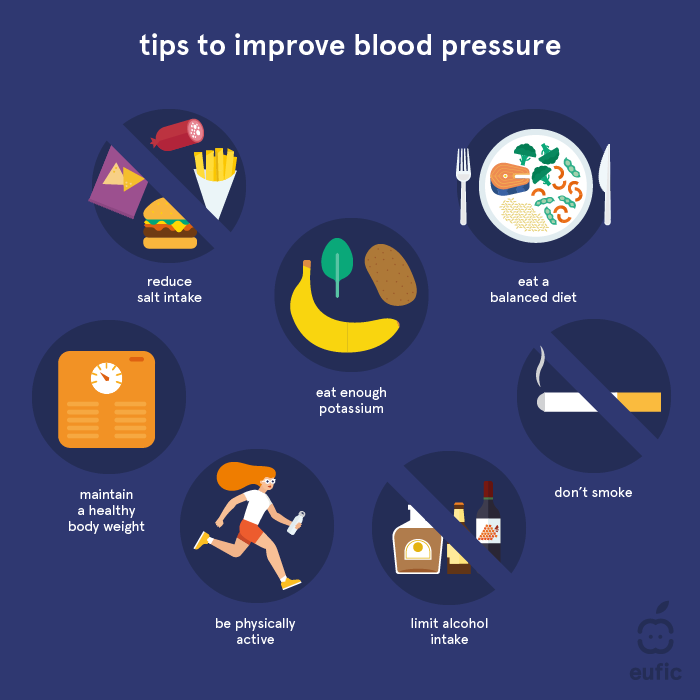
  • Blood pressure: Levels less than 120/80 millimeters of mercury (mm Hg) remain optimal. Stage 1 hypertension is 130 to 139 mm Hg for systolic pressure (the first number) or 80 to 89 mm Hg for diastolic pressure (the second number).
  • You can calculate your heart health score at mlc.heart.org. The guidelines were published online June 29, 2022, by Circulation.

Read more

Cardiometabolic Health: 93% Of U.S. Adults Fail Test

Less than 7% of the U.S. adult population has good cardiometabolic health, a devastating health crisis requiring urgent action, according to research led by a team from the Friedman School of Nutrition Science and Policy at Tufts University in a pioneering perspective on cardiometabolic health trends and disparities published in the July 12 issue of the Journal of the American College of Cardiology. Their team also included researchers from Tufts Medical Center.

Researchers evaluated Americans across five components of health: levels of blood pressure, blood sugar, blood cholesterol, adiposity (overweight and obesity), and presence or absence of cardiovascular disease (heart attack, stroke, etc.). They found that only 6.8 percent of U.S. adults had optimal levels of all five components as of 2017-2018.

Infographic: ‘Stay Active To Lower Blood Pressure’

Click here to enlarge
  • High blood pressure is one of the most common modifiable risk factors for heart disease and stroke in women.
  • Approximately, 1 in 2 adult women in the US has elevated blood pressure (>120/80).
  • Physical activity can help to prevent and control blood pressure by strengthening the heart, contributing to a healthy weight, and reducing stress. 

Read more

Science Podcast: Spinal Cord Injury Device, Hand Gestures & Saturn’s Tilt

A neuroprosthetic device restores blood-pressure control after spinal-cord injury, and identifying the neurons that help us understand others’ beliefs.

In this episode:

00:47 A neuroprosthetic restores the body’s baroreflex

A common problem for people who have experienced spinal-cord injury is the inability to maintain their blood pressure, which can have serious, long-term health consequences. Now, however, researchers have developed a device that may restore this ability, by stimulating the neural circuits involved in the so-called baroreflex.

Research Article: Squair et al.

News and Views: Neuroprosthetic device maintains blood pressure after spinal cord injury

08:27 Research Highlights

How gesticulating changes the way that speech is perceived, and a new theory of how Saturn got its tilt.

Research Highlight: Hands speak: how casual gestures shape what we hear

Research Highlight: The moon that made Saturn a pushover

10:58 A neuronal map of understanding others

Humans are very good at understanding that other people have thoughts, feelings and beliefs that are different to our own. But the neuronal underpinnings of this ability have been hard to unpick. Now, researchers have identified a subset of neurons that they think gives us this ability.

Research Article: Jamali et al.

18:04 Briefing Chat

We discuss some highlights from the Nature Briefing. This time, the science of why cats love catnip, and the struggle to identify what the mysterious celestial object StDr 56 actually is.

Science: Why cats are crazy for catnip

Syfy Wire: So what the heck is StDr 56?

Health Studies: 80% Of Married Couples Share Heart Disease Risks, Poor Health Lifestyles (JAMA)

OCTOBER 26, 2020

In this cross-sectional study of 5364 couples consisting of employees and spouses (or domestic partners) undergoing an annual employer-sponsored health assessment, 79% of the couples were in the nonideal category of a CV health score. This within-couple concordance of nonideal CV health scores was associated mostly with unhealthy diet and inadequate physical activity.

The study included 10 728 participants (5364 couples): 7% were African American, 11% Hispanic, 21% Asian, and 54% White (median [interquartile range] age, 50 [41-57] years for men and 47 [39-55] for women). For most couples, both members were in the ideal category or both were in a nonideal category.

Concordance ranged from 53% (95% CI, 52%-54%) for cholesterol to 95% (95% CI, 94%-95%) for diet. For the CV health score, in 79% (95% CI, 78%-80%) of couples both members were in a nonideal category, which was associated mainly with unhealthy diet (94% [95% CI, 93%-94%] of couples) and inadequate exercise (53% [95% CI, 52%-55%] of couples). However, in most couples, both members were in the ideal category for smoking status (60% [95% CI, 59%-61%] of couples) and glucose (56% [95% CI, 55%-58%]).

Except for total cholesterol, when 1 member of a couple was in the ideal category, the other member was likely also to be in the ideal category: the adjusted odds ratios for also being in the ideal category ranged from 1.3 (95% CI, 1.1-1.5; P ≤ .001) for blood pressure to 10.6 (95% CI, 7.4-15.3; P ≤ .001) for diet. Concordance differed by ethnicity, socioeconomic status, and geographic location.

Read full study

Health Video: ‘Surgeon General Hypertension Report’ (JAMA Network)

The US Surgeon General’s office has released a report emphasizing the importance of making hypertension control a national public health priority. Vice Admiral Jerome Adams, MD, MPH, the 20th US Surgeon General, discusses the report’s background and recommendations.

Recorded October 7, 2020.

Infographics: “Reducing Salt In Diet & Foods To Improve Blood Pressure”

Tip To Improve Blood Pressure - Infographic - Eufic

Does reducing salt improve our blood pressure?

There is consistent evidence that moderate reductions (i.e. a decrease of 3 to 5 g or ½ to 1 teaspoon a day) in salt intake can lead to a reduction in blood pressure.5,6 However, these effects may not be the same for everyone and will depend on an individual’s starting blood pressure (greater benefits are seen in those with higher blood pressure), their current level of salt intake, genetics, disease status and medication use.

It is important to note that salt is not the only lifestyle factor that can influence our blood pressure. Other factors such as eating enough potassium, maintaining a healthy body weight, not smoking, and being physically active are also important when it comes to reducing blood pressure. You can find 7 lifestyle tips to help reduce blood pressure here.

High salt foods:

  • Processed meats such as bacon, salami, sausages and ham
  • Cheeses
  • Gravy granules, stock cubes, yeast extracts
  • Olives, pickles and other pickled foods
  • Salted and dry-roasted nuts and crisps
  • Salted and smoked meat and fish
  • Sauces: soy sauce, ketchup, mayonnaise, BBQ sauce

How Much Salt Is Too Much Salt - Infographic Eufic

What is salt?

Salt is the common name for sodium chloride (or NaCl). It consists of 40% sodium and 60% chloride. In other words, 2.5 g of salt contains 1 g of sodium and 1.5 g of chloride.

Why do we need salt?

Both sodium and chloride are essential for many body functions. They help regulate blood pressure, control fluid balance, maintain the right conditions for muscle and nerve function and allow for the absorption and transport of nutrients across cell membranes. Chloride is also used to produce stomach acid (hydrochloric acid, HCl) which helps us digest foods.

How much salt do we need per day?

The exact minimum daily requirement for salt is unknown, but it is thought to be around 1.25 g – 2.5 g (0.5 – 1 g sodium) per day.1 As salt is found in a large variety of foods the risk of deficiency is low.1,2 The European Food Safety Authority (EFSA) has stated that a salt intake of 5 g per day (equivalent to 2 g of sodium) is sufficient to meet both our sodium and chloride requirements as well as reduce our risk of high blood pressure and heart disease.1,2 This is equivalent to around 1 teaspoon of salt per day from all sources.

Both sodium and chloride are released from our body through our urine and when we sweat. This means bouts of heavy sweating such as during exercise can increase our salt requirements slightly. However, as most people consume well above required levels it is usually not necessary to increase salt intake during these conditions.1

Website

Health: The Benefits Of “Intermittent Fasting” For People In High-Stress Jobs

From Oxford University Press – OUP (May 1, 2020):

…ultra-processed foods are generally the foods available to nurses working nightshifts, firefighters returning to their department after a call, police officers Intermittent Fasting Article in OUP May 1 2020patrolling neighborhoods, or military soldiers during field-exercises. Thus, time-restricted eating removes the added stress of what to eat, and serves as a practical intervention conducive to the schedules of many people.

Time-restricted eating has been shown to lower circulating insulin, blood pressure, body fat and overall body weight, inflammation, and oxidative stress.

Time-restricted eating is a nutrition intervention which alternates between a period of fasting (12 – 16 hours) followed by a period of eating (8 – 12 hours). Unlike other diets, which focus on the caloric content of a meal or which foods you should eat, time-restricted eating focuses exclusively on when you eat by compressing and standardizing the feeding window each day. In turn, people following this type of eating pattern naturally enter a state of caloric deficit.

Read full article

Nutrition Reviews - Time-Restricted Feeding

Read Study in Nutrition Reviews

Diet Infographic: Most “Macronutrient Diets” Reduce Weight & Blood Pressure In 6 Months (BMJ)

F1.large

From a BMJ Study article (April, 2020):

Compared with usual diet, moderate certainty evidence supports modest weight loss and substantial reductions in systolic and diastolic blood pressure for low carbohydrate (eg, Atkins, Zone), low fat (eg, Ornish), and moderate macronutrient (eg, DASH, Mediterranean) diets at six but not 12 months. Differences between diets are, however, generally trivial to small, implying that people can choose the diet they prefer from among many of the available diets (fig 6) without concern about the magnitude of benefits.

Introduction

The worldwide prevalence of obesity nearly tripled between 1975 and 2018.1 In response, authorities have made dietary recommendations for weight management and cardiovascular risk reduction.23 Diet programmes—some focusing on carbohydrate reduction and others on fat reduction—have been promoted widely by the media and have generated intense debates about their relative merit. Millions of people are trying to lose weight by changing their diet. Thus establishing the effect of dietary macronutrient patterns (carbohydrate reduction v fat reduction v moderate macronutrients) and popular named dietary programmes is important.

Biological and physiological mechanisms have been proposed to explain why some dietary macronutrient patterns and popular dietary programmes should be better than others. A previous network meta-analysis, however, suggested that differences in weight loss between dietary patterns and individual popular named dietary programmes are small and unlikely to be important.4 No systematic review and network meta-analysis has examined the comparative effectiveness of popular dietary programmes for reducing risk factors for cardiovascular disease, an area of continuing controversy.

Read entire study

Study: Sunlight Exposure Lowers Blood Pressure, Avoiding It Is Risk Factor For Hypertension (AHA)

From an American Heart Assoc. Journal study (Feb 28, 2020):

American Heart Association LogoSeasonal variation in blood pressure has been known for 40 years, but, to our knowledge, for the first time we show here that this occurs independently of temperature. The reduction in blood pressure is more marked with a rise in UVB than UVA, and in whites than black people. Dermatological concerns about the skin cancer inducing effects of UV radiation need to be balanced against the observed blood pressure lowering effects of sunlight, particularly given the greatly higher burden of disease caused by hypertension.

Incident Solar Ultraviolet Exposure lowers Blood Pressure AHA Feb 28 2020Sunlight exposure appears to lower blood pressure; insufficient exposure to natural ultraviolet radiation and/or active avoidance of sunlight may be new risk factors for hypertension.

Hypertension remains a leading global cause for premature death and disease. Most treatment guidelines emphasize the importance of risk factors, but not all are known, modifiable, or easily avoided. Population blood pressure correlates with latitude and is lower in summer than winter. Seasonal variations in sunlight exposure account for these differences, with temperature believed to be the main contributor. Recent research indicates that UV light enhances nitric oxide availability by mobilizing storage forms in the skin, suggesting incident solar UV radiation may lower blood pressure. We tested this hypothesis by exploring the association between environmental UV exposure and systolic blood pressure (SBP) in a large cohort of chronic hemodialysis patients in whom SBP is determined regularly.

Read full study