

Tag Archives: Infographics
Health Infographic: “Signs Of Heart Disease In Women” (Mayo Clinic)

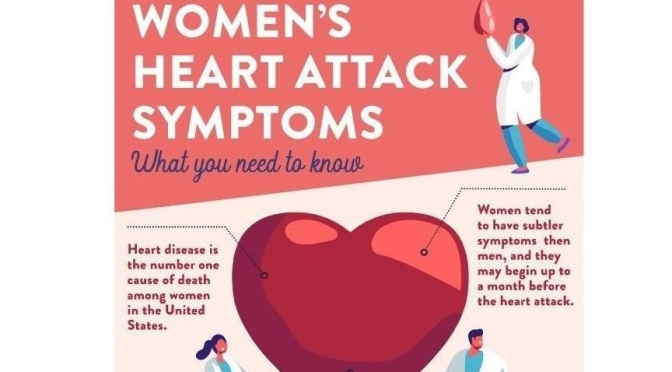
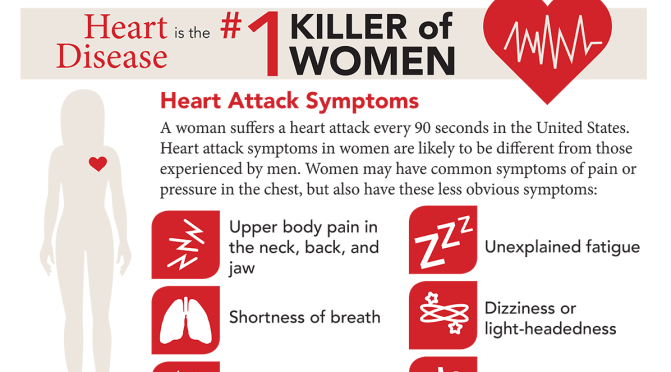
Health Infographics: “Women’s Heart Attack Symptoms” (Scripps)
Heart disease is the number one cause of death among women in the United States. It takes the lives of nearly twice as many women as all forms of cancer combined, yet many women know very little about their heart health.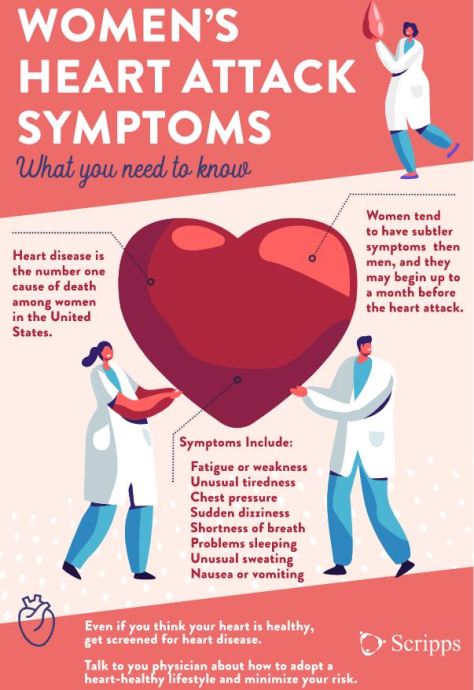 Heart attack symptoms in women
Women tend to have subtler symptoms, and they may begin up to a month before the heart attack. Symptoms include:
- Fatigue or weakness
- Unusual tiredness
- Pressure, or tightness in the center of the chest
- Pain that spreads to the upper body, neck or jaw
- Unusual sweating, nausea or vomiting
- Sudden dizziness
- Shortness of breath
- Problems sleeping
Because many of these symptoms can be associated with common illnesses such as the flu, women are more likely to brush them off or assume something less serious is going on — and that can be a serious or even fatal mistake. If you experience these symptoms, don’t ignore them. Play it safe and call 911. The sooner you get treatment, the greater the chances of recovery.
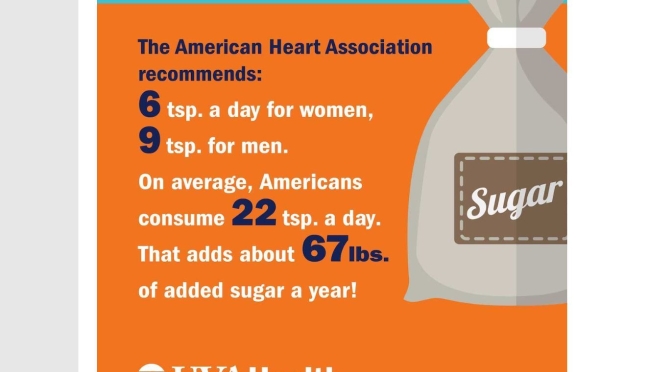
Health Infographics: “Hidden Sugars” In What We Eat & Drink Add Up Fast


Media Infographics: “Radio’s Unparalleled Reach” In U.S. (Statista)
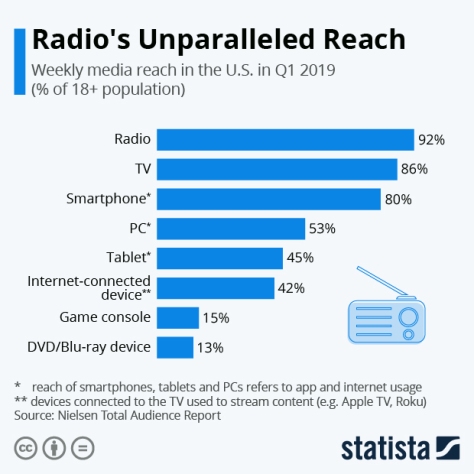
With all the talk about digital media, it’s easy to forget how powerful traditional media such as radio and television still are. Radio in particular rarely gets credited for what it still is: a true mass medium. According to Nielsen, radio even trumps TV in terms of its weekly reach.
According to Nielsen’s measurements, far more than 200 million Americans aged 18 and older listen to the radio at least once a week, equaling a reach of 92 percent of the adult population. Television came in a close second with a weekly reach of 86 percent, while 80 percent of U.S. adults now use apps or browse the web on a smartphone in any given week.
While radio does win in terms of sheer reach, TV remains unparalleled with respect to average daily usage. According to Nielsen’s measurements, U.S. adults spend an average of 4 hours and 27 minutes a day watching TV (live and time-shifted), which is more than 2.5 times the amount of time they listen to the radio (1h 42m).

Health Infographics: The Most Common Types Of Cancer In U.S. By Gender

Cardiovascular disease remains the leading cause of death worldwide among middle-aged adults. However, deaths from cancer are catching up in high-income countries according to a study recently published in the medical journal The Lancet. Researchers calculated that cancer kills about twice as many people as cardiovascular disease in more developed countries. Globally, cancer could become the leading cause of death in just a few decades, the study said.

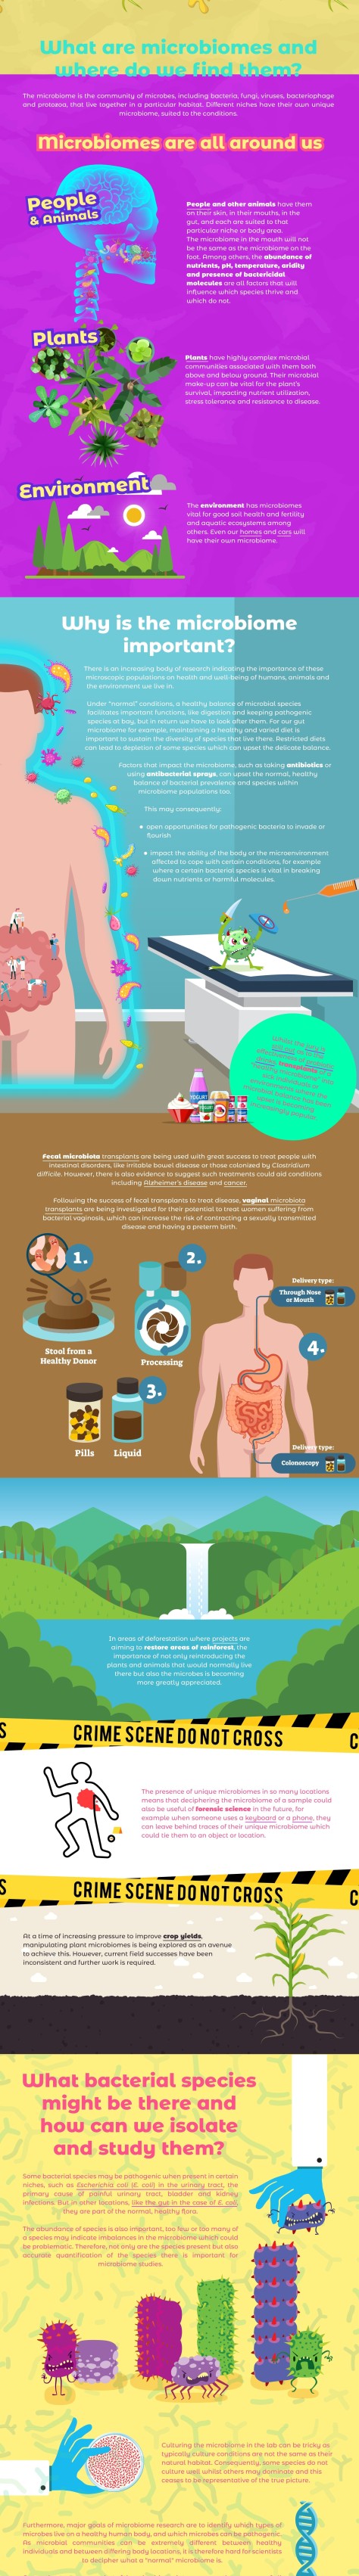
Health Infographics: “What Are Microbiomes?”

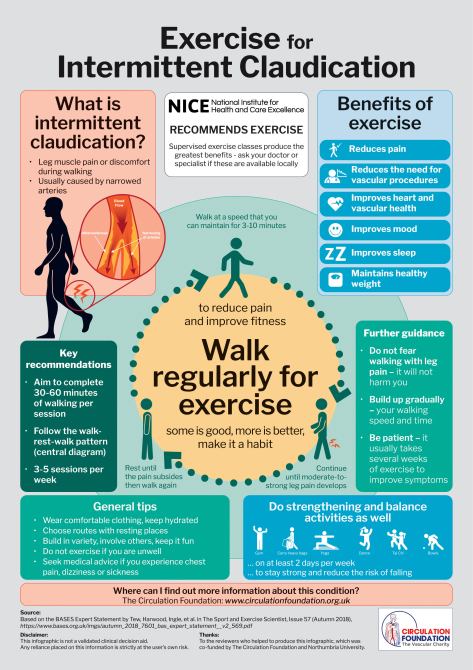
Infographic: Exercise For Intermittent Leg Pain & Walking (Claudication)

Health: Diagnosing “Essential Tremor” Movement Disorder
From a NextAvenue.org online article (01/07/20):
 Essential tremor is a common movement disorder — more common than tremors that come with Parkinson’s disease — and the most common neurologic condition affecting people 65 and older. It is estimated that 10 million Americans live with essential tremor, according to the International Essential Tremor Foundation.
About half of people with essential tremor inherited the condition. But the severity and affected body parts can differ from generation to generation, and researchers still haven’t pinned down the gene or genes responsible.
Tremors typically happen when people try to use their hands for a task. Activities such as shaving can be difficult’ people often need to use safety razors or electric razors to avoid cutting or nicking themselves. Also, difficulty holding a utensil makes eating a challenge for many people with essential tremor.

Infographics: “Chronic Pain Statistics” (2018)

