

Tag Archives: Infographic
Infographics: “The New Normal” Post Covid-19

The new normal?
![]() It is impossible to ignore the ongoing impact the Covid-19 pandemic is having on our lives. This month our infographic shows how some aspects of daily life have changed as a result. The widespread closure of schools, for example, is thought to have affected up to 1.38 billion learners as of late March. Meanwhile, the sudden shift to remote working is one such change expected to have long-lasting effects. Following the pandemic, 68% of Germans have stated they would like to work remotely more often.
It is impossible to ignore the ongoing impact the Covid-19 pandemic is having on our lives. This month our infographic shows how some aspects of daily life have changed as a result. The widespread closure of schools, for example, is thought to have affected up to 1.38 billion learners as of late March. Meanwhile, the sudden shift to remote working is one such change expected to have long-lasting effects. Following the pandemic, 68% of Germans have stated they would like to work remotely more often.
Our designer Raphael Hammer has created an isometric-style illustration, with each topic area allocated its own quarter of the infographic. Each topic is then afforded its own principle colour and corresponding design details. The almost monochrome effect of the illustrations allows them to perfectly complement the data presented. Especially effective, are the subtle movements which bring the entire graphic to life.
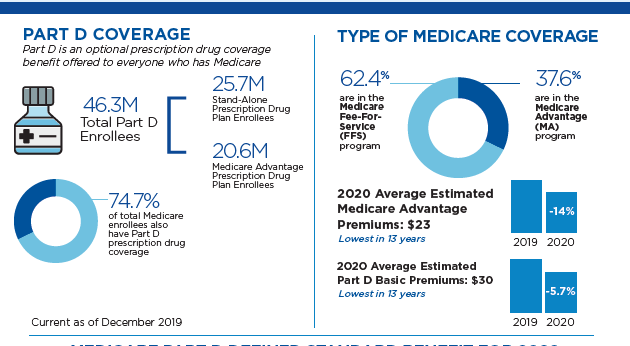
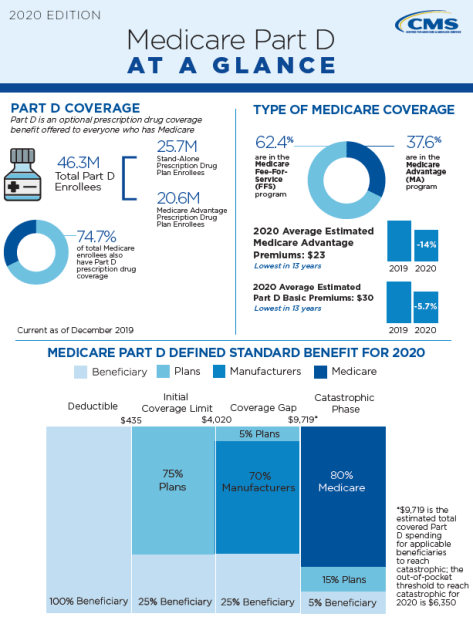
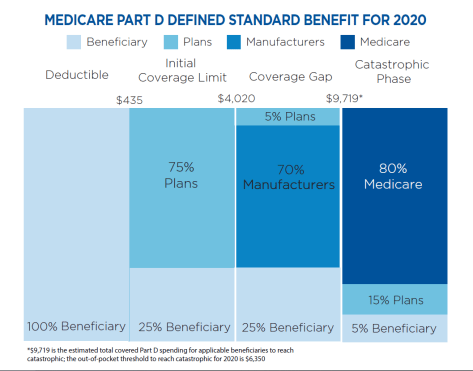
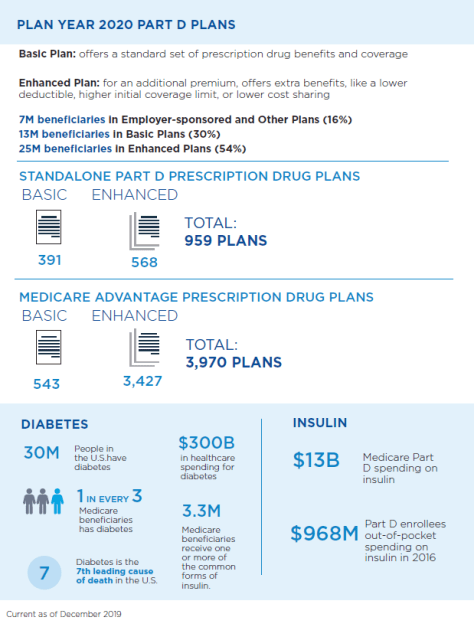
Infographic: “Medicare Part D At A Glance” (2020)

Health Infographic: “The Wide Impact Of The Covid-19 Lockdown” (BMJ)


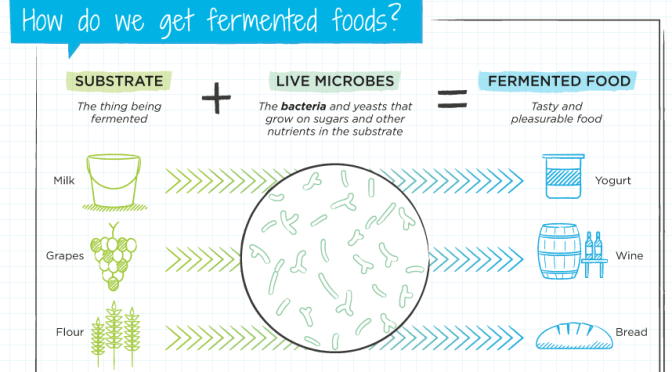
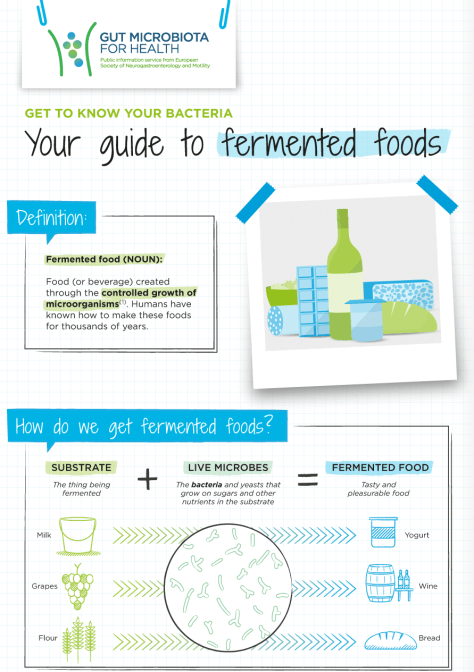
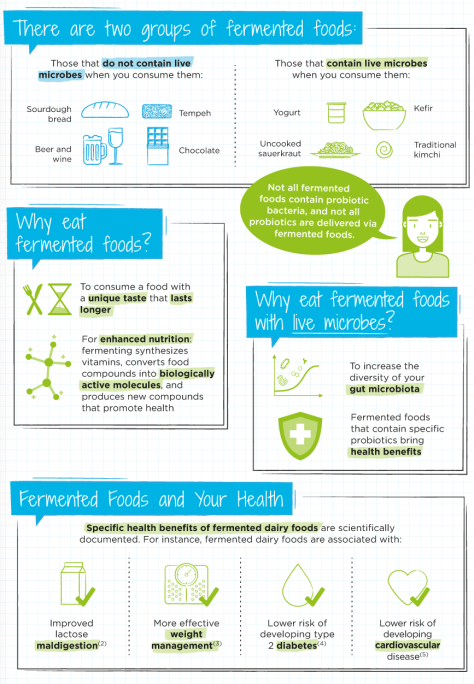
Infographics: “What Are, How We Get And Why Do We Eat Fermented Foods”
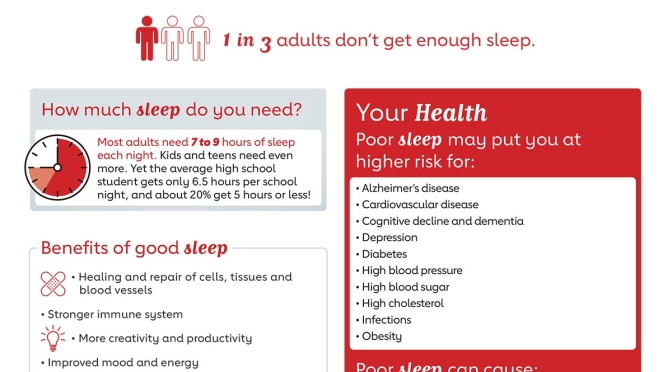
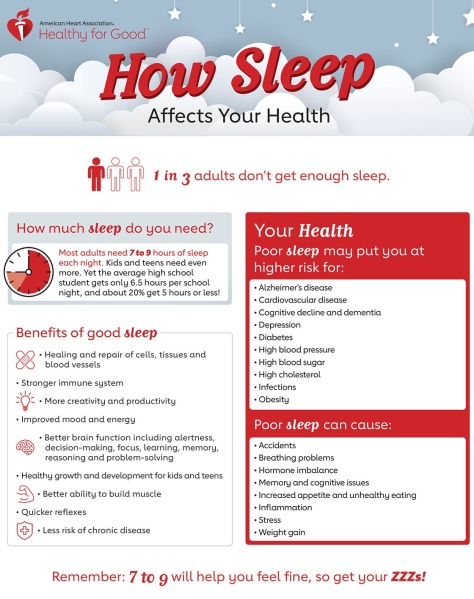
Infographics: “How Sleep Affects Your Health”

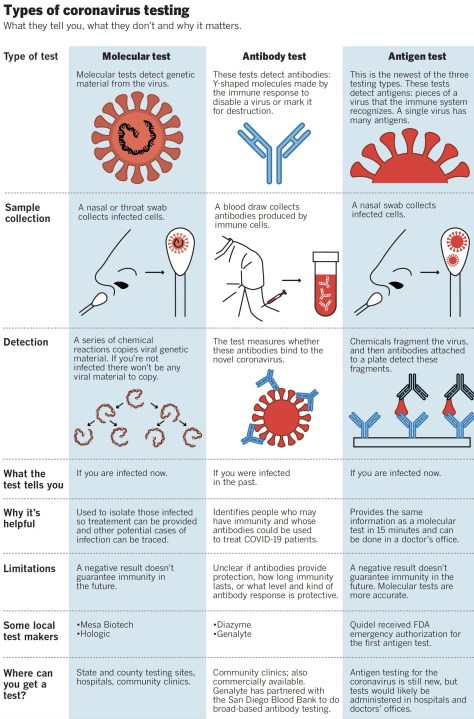
New Infographic: “Types Of Coronavirus Testing”

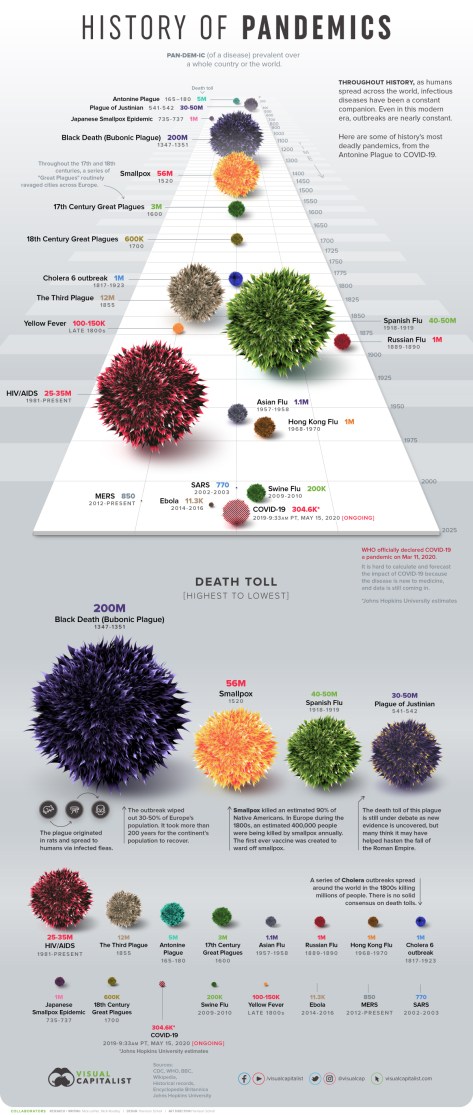
Infographic: A Look At The “History Of Pandemics”
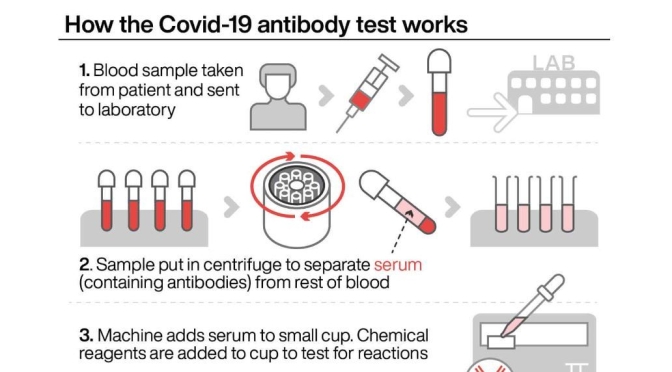
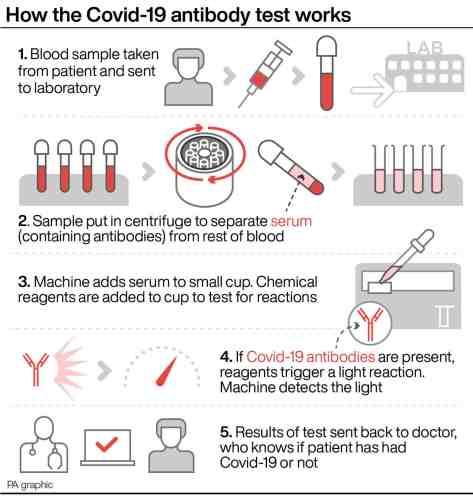
Health: “How The Covid-19 Antibody Test Works”
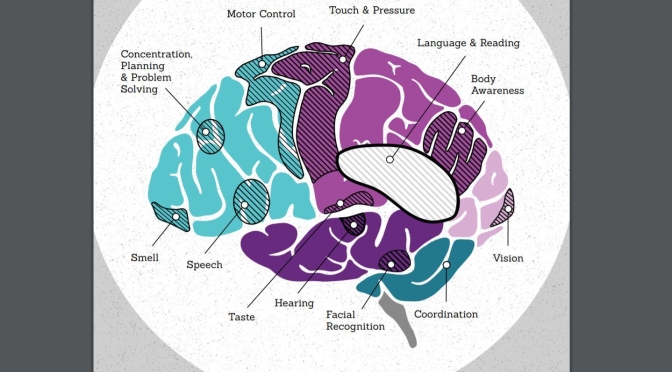
Top Science Infographics: “Neurogenomics”, Brain Function & Development

W
