The @UN projects that by 2100 the earth's population will hit 10.9 billion people, but do all researchers think the same?
— Statista (@StatistaCharts) November 24, 2021
Researchers at @UW assume that by 2100, the population of the world will be between 6.3 and 8.8 billion people.
Thoughts?
Tag Archives: Statistics

Infographic: Vaccination Effect On Covid-19 Deaths

Covid-19: Acceleration In Cases By State – Sep 6, 2021


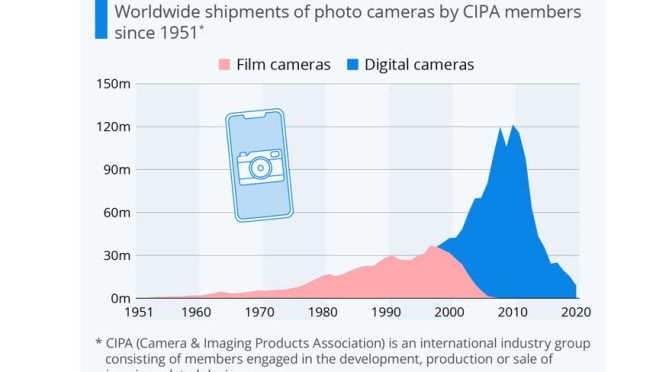
Infographic: 40 Years Of Camera Sales Growth Ended By Smartphones
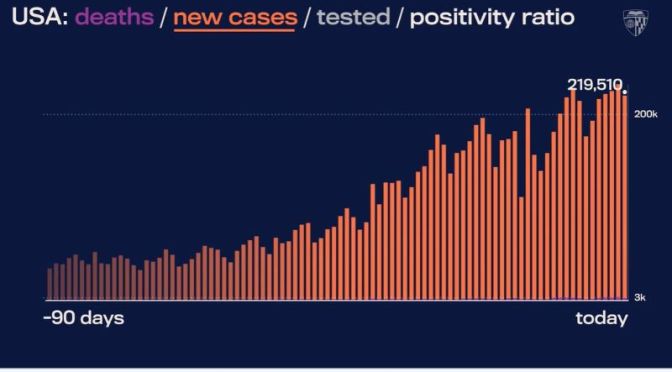
Health: American ‘Covid-19 Data In Motion’ (Video)
Video highlights of COVID-19 data trends as of December 13, 2020. This daily report shares critical data on the spread of COVID-19 over the last 24 hours.
For the latest news, trends, and expert insights on the coronavirus pandemic, visit the JHU Coronavirus Resource Center: https://coronavirus.jhu.edu/
Explore COVID-19 trends around the world with our in-depth data tracking: New cases and cumulative cases: https://coronavirus.jhu.edu/data/cumu…
Daily new cases, testing, and positivity ratio by U.S. state: https://coronavirus.jhu.edu/testing/t…
New cases by country: https://coronavirus.jhu.edu/data/new-…
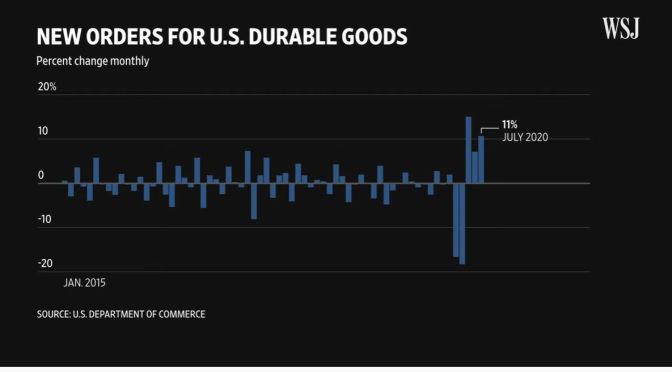
Economy: “Durable Goods Explained” (WSJ Videos)
The survey of new orders for long-lasting goods contains one of the most closely watched U.S. economic indicators. WSJ explains durable goods, and why investors look beyond the headline number for a better read on business activity.
Photo: Josie Norris/The San Antonio Express-News

Infographics: The Major Challenges Restaurants Face Post Covid-19 (2020)
Restaurants must function at 75% capacity in order to achieve profitability. With many restaurants operating at 50% capacity or less, how do they make up the remaining 25%? The three main contributing factors are contactless dining, labor optimization and changing the customer journey. Learn more about how restaurants are recovering during the COVID-19 pandemic in this infographic by OneDine.