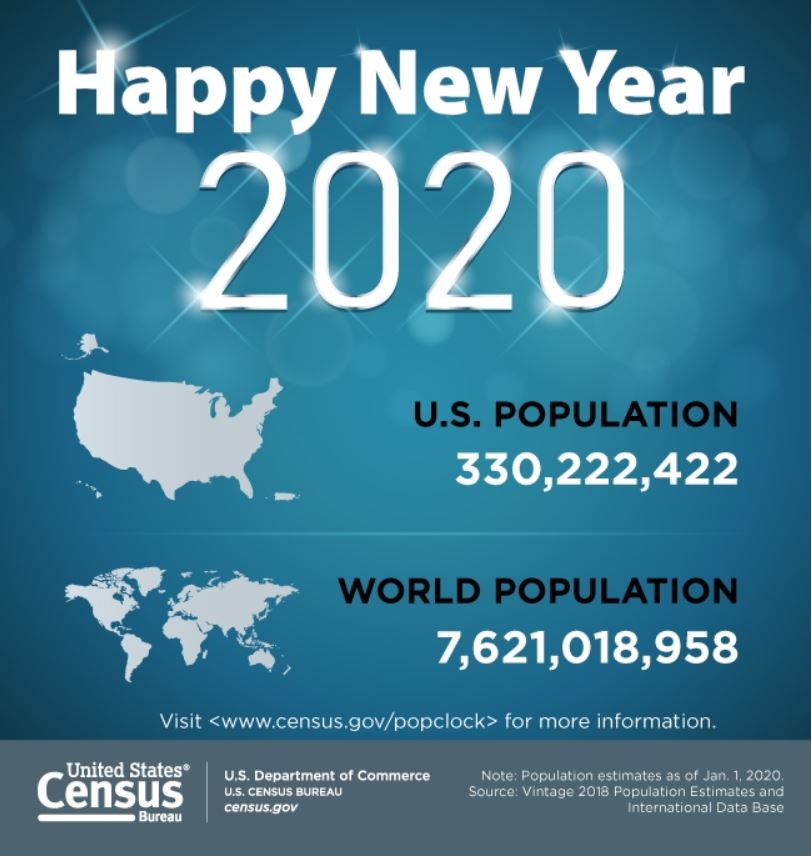
DEC. 30, 2019 — As the nation prepares to ring in the new year, the U.S. Census Bureau projects the U.S. population will be 330,222,422 on Jan. 1, 2020. This represents an increase of 1,991,085, or 0.61%, from New Year’s Day 2019. Since Census Day (April 1) 2010, the population has grown by 21,476,884 or 6.96%.
In January 2020, the United States is expected to experience one birth every eight seconds and one death every 11 seconds. Meanwhile, net international migration is expected to add one person to the U.S. population every 34 seconds. The combination of births, deaths and net international migration will increase the U.S. population by one person every 19 seconds.
The projected world population on Jan. 1, 2020, is 7,621,018,958, an increase of 77,684,873, or 1.03%, from New Year’s Day 2019. During January 2020, 4.3 births and 1.9 deaths are expected worldwide every second.
The Census Bureau’s U.S. and World Population Clock simulates real-time growth of the United States and world populations at <www.census.gov/popclock>.
Website


 The National Diabetes Statistics Report is a periodic publication of the Centers for Disease Control and Prevention (CDC) that provides updated statistics about diabetes in the United States for a scientific audience. It includes information on prevalence and incidence of diabetes, prediabetes, risk factors for complications, acute and long-term complications, deaths, and costs. These data can help focus efforts to prevent and control diabetes across the United States.
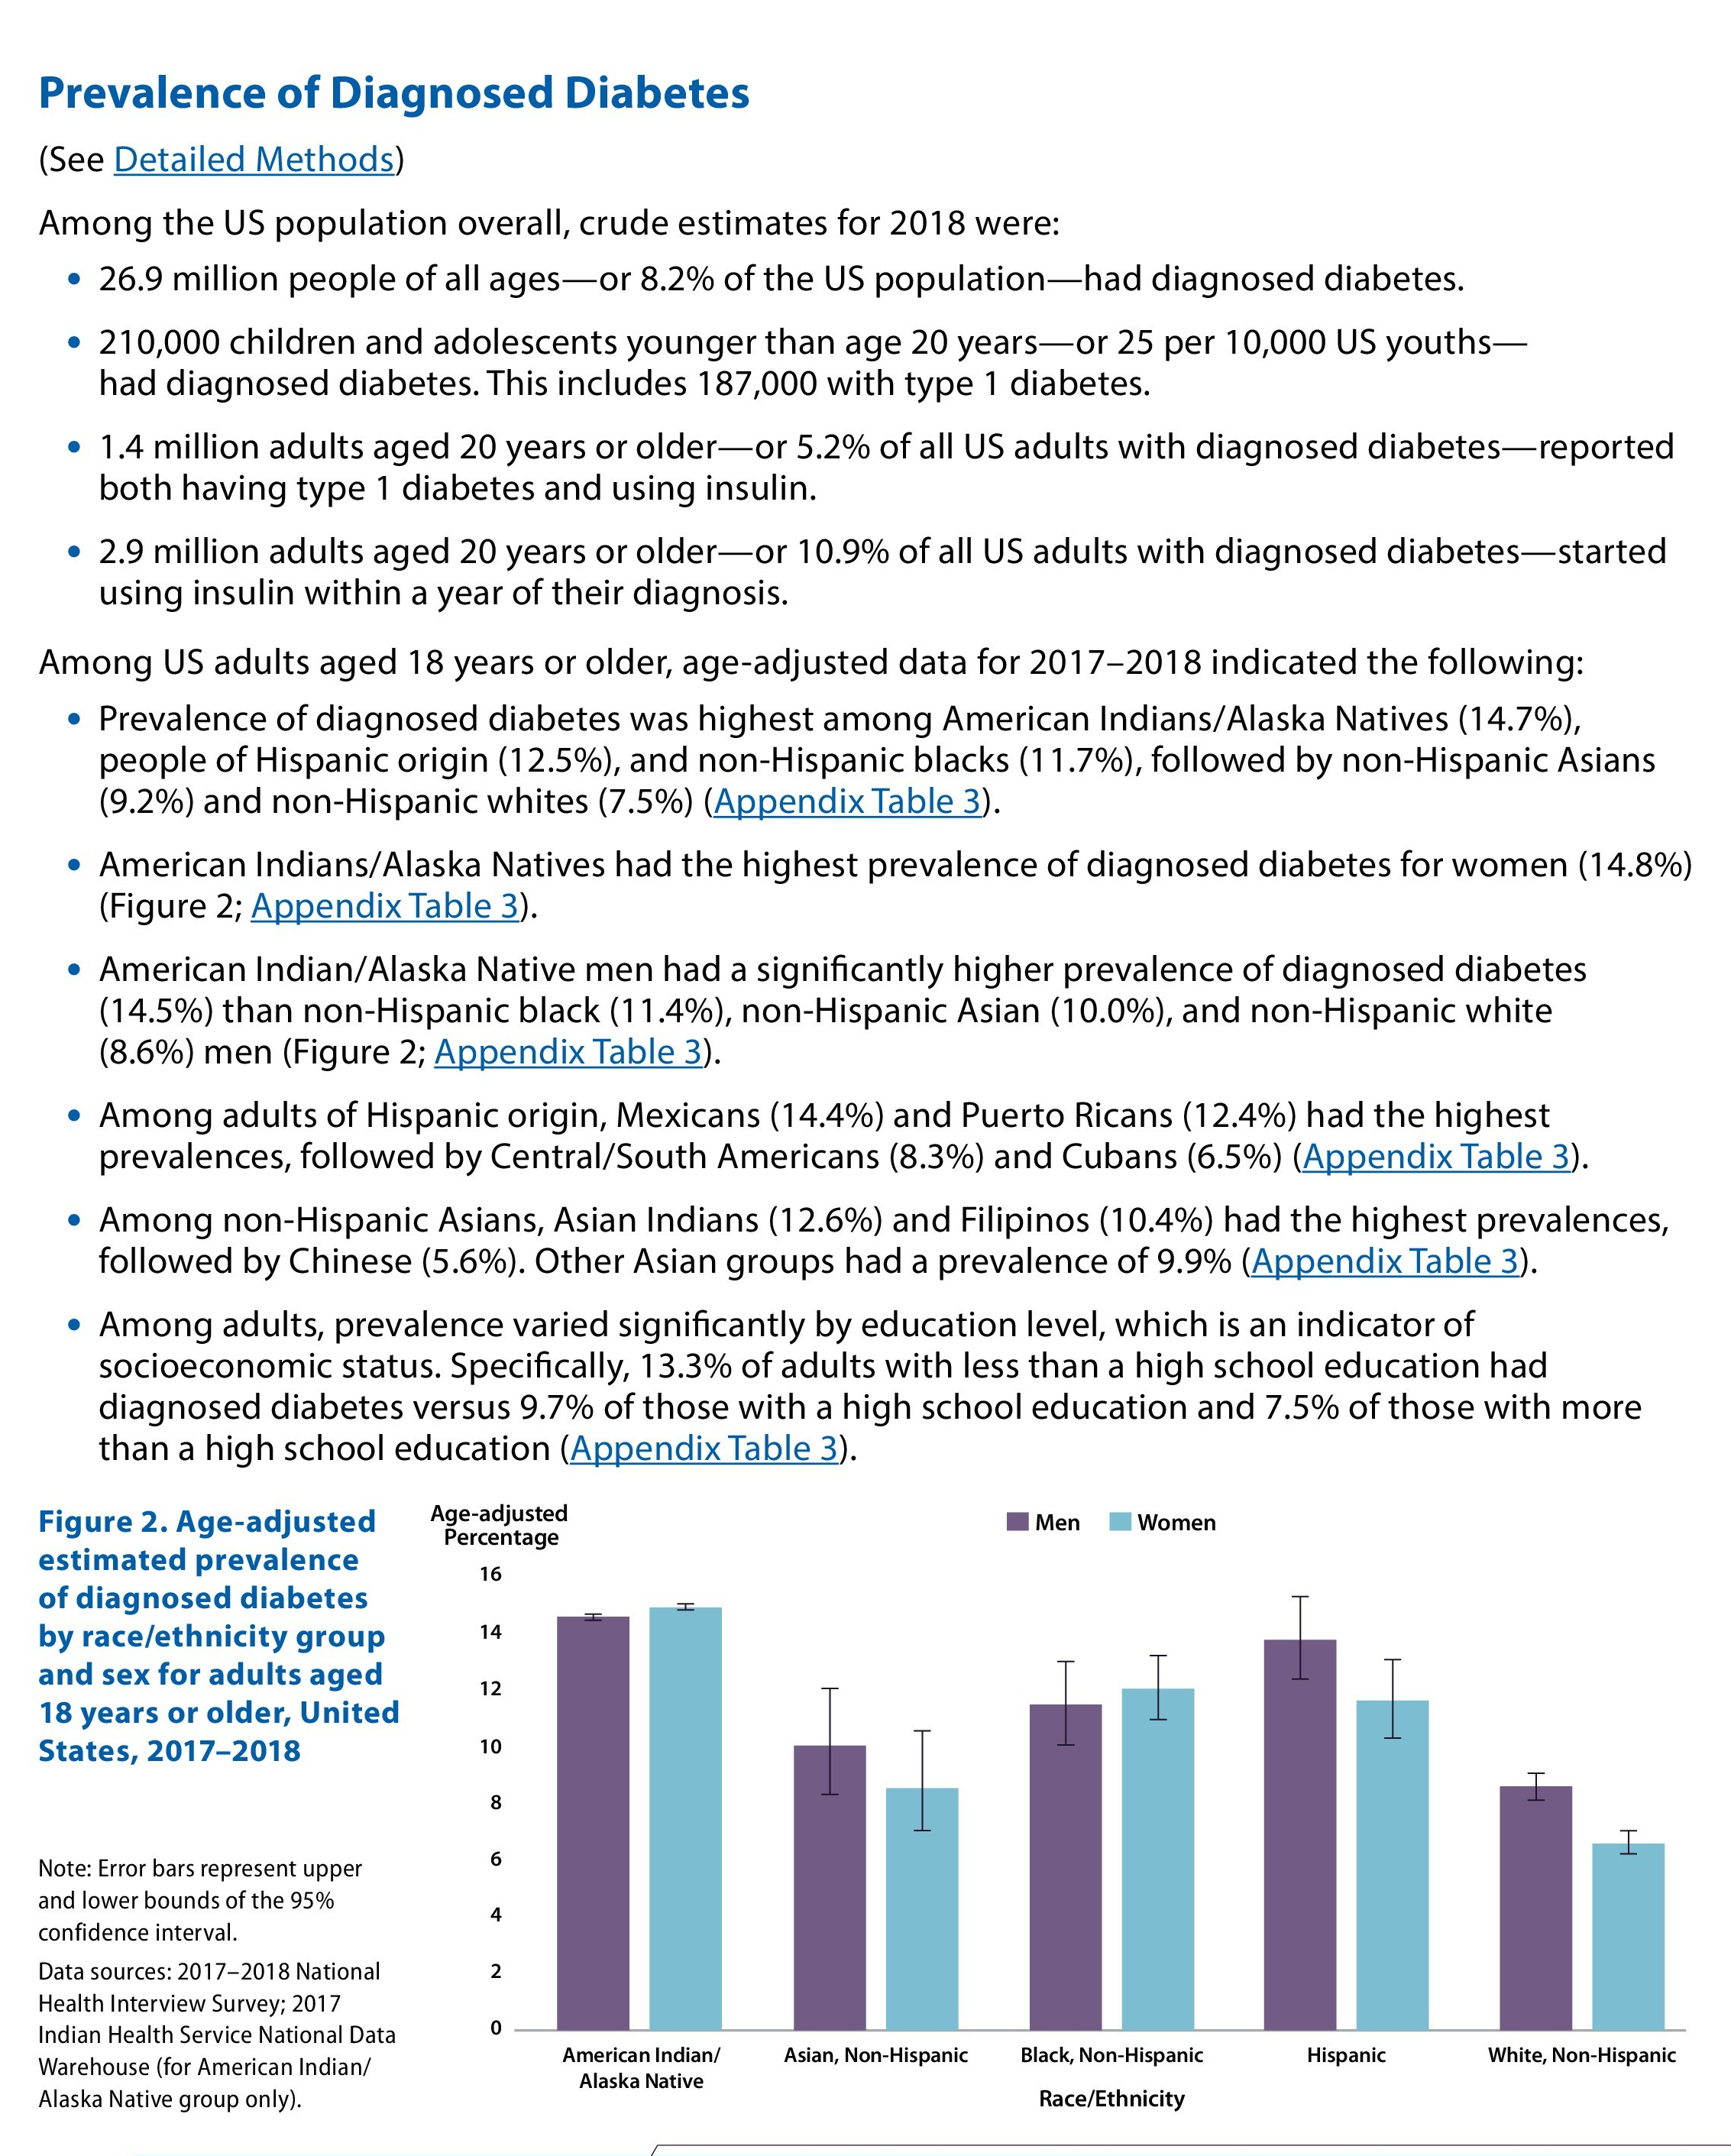

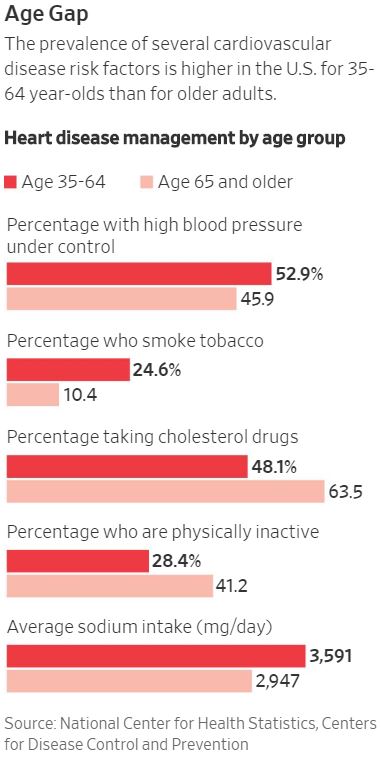 Death rates from cardiovascular disease among people between the ages of 45 and 64 are rising in cities all across the country, including in some of the most unlikely places.
