
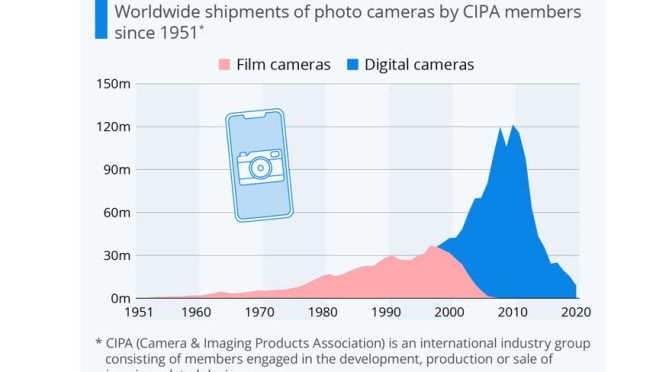
#Smartphone cameras have improved significantly and so much so, that many people no longer see the need to carry or buy a dedicated camera.
— Statista (@StatistaCharts) August 19, 2021
To the #camera and photo equipment industry, the rise of smartphone #photography has had devastating effects.https://t.co/hJvruHel63 pic.twitter.com/NS8LmHHu3L
Tag Archives: Charts

Covid-19: The Economist ‘Global Normalcy Index’
Across much of the world, covid-19 restrictions are starting to ease. The Economist has crunched the data to calculate how close countries are to pre-pandemic levels of normality—but will life ever be the same again? Read more here: https://econ.st/3AG9siz

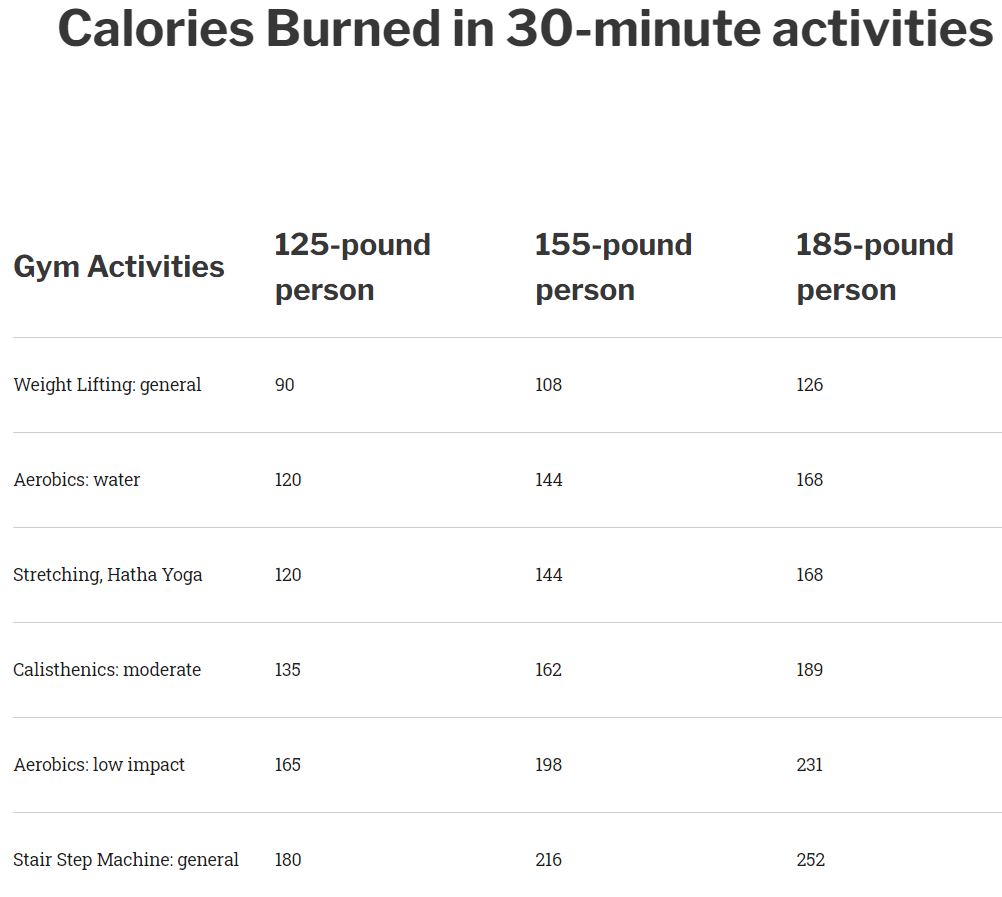
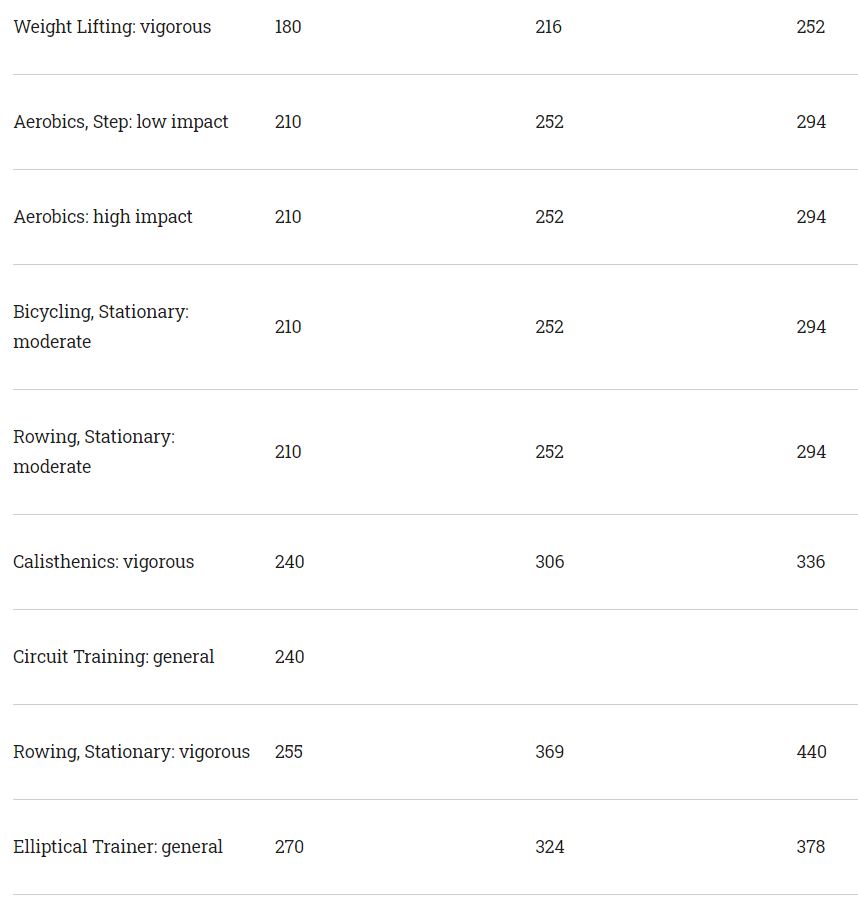
Charts: Calories Burned In 30-Minutes Of Exercise


Health: “Making Sense Of Coronavirus Data” (Video)
Public health organizations track the spread of coronavirus and use graphs and charts to visualize the data. WSJ’s Brianna Abbott explains what to look for in the data to understand how the virus is impacting your community.
Photo illustration: Laura Kammermann/WSJ

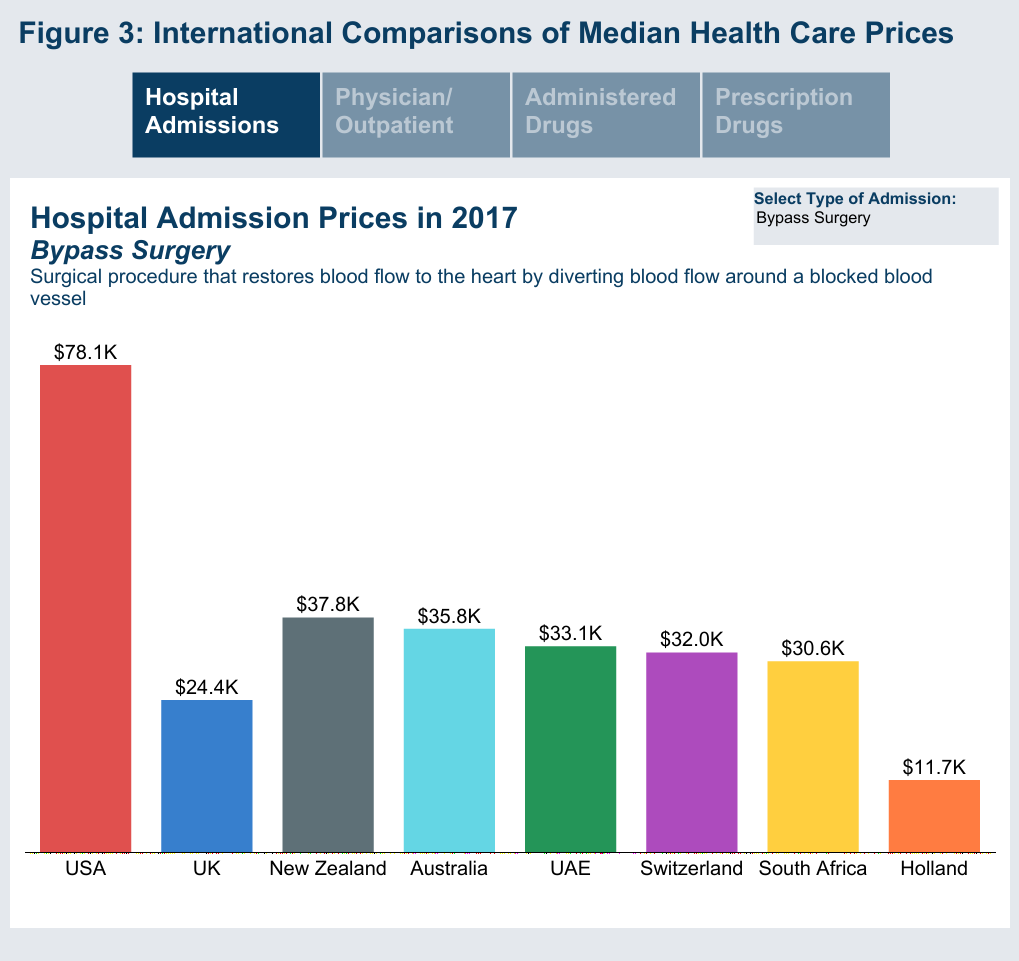
Healthcare: U.S. “Bypass Surgery” Costs Were $78.1K In 2017, Up To 6 Times The Cost In Europe (Chart)
Healthcare: U.S. “Total Hip Replacement” Costs Were $32.5K In 2017, Up To 4 Times The Cost In Europe (Chart)
From a Health Care Cost Institute (HCCI) release (12/17/19):
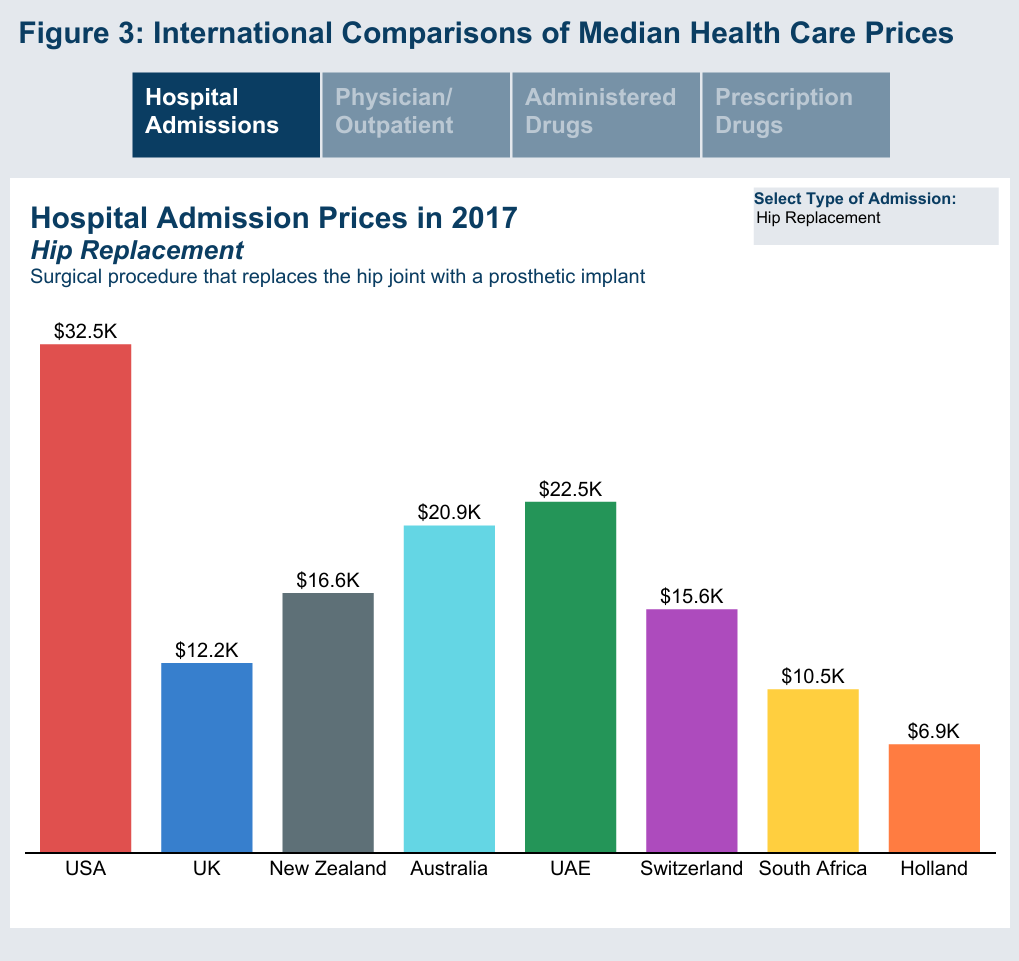
- Holland had the lowest prices for hip and knee replacements with prices less than 25% of the US price. Prices for hip and knee replacements in the United Arab Emeritus (UAE) were the closest to the US at 71% of the price.
