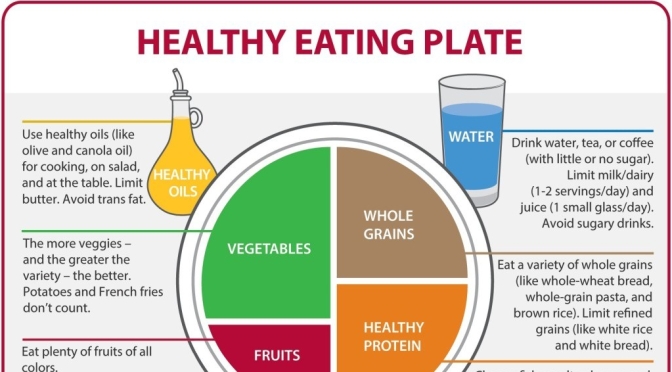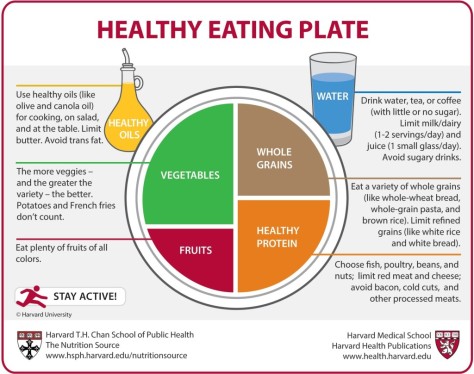
Aim for color and variety, and remember that potatoes don’t count as vegetables on the Healthy Eating Plate because of their negative impact on blood sugar.
Whole and intact grains—whole wheat, barley, wheat berries, quinoa, oats, brown rice, and foods made with them, such as whole wheat pasta—have a milder effect on blood sugar and insulin than white bread, white rice, and other refined grains.
Fish, poultry, beans, and nuts are all healthy, versatile protein sources—they can be mixed into salads, and pair well with vegetables on a plate. Limit red meat, and avoid processed meats such as bacon and sausage.
Choose healthy vegetable oils like olive, canola, soy, corn, sunflower, peanut, and others, and avoid partially hydrogenated oils, which contain unhealthy trans fats. Remember that low-fat does not mean “healthy.”
Skip sugary drinks, limit milk and dairy products to one to two servings per day, and limit juice to a small glass per day.
The red figure running across the Healthy Eating Plate’s placemat is a reminder that staying active is also important in weight control.
The main message of the Healthy Eating Plate is to focus on diet quality.
- The type of carbohydrate in the diet is more important than the amount of carbohydrate in the diet, because some sources of carbohydrate—like vegetables (other than potatoes), fruits, whole grains, and beans—are healthier than others.
- The Healthy Eating Plate also advises consumers to avoid sugary beverages, a major source of calories—usually with little nutritional value—in the American diet.
- The Healthy Eating Plate encourages consumers to use healthy oils, and it does not set a maximum on the percentage of calories people should get each day from healthy sources of fat. In this way, the Healthy Eating Plate recommends the opposite of the low-fat message promoted for decades by the USDA.
Website


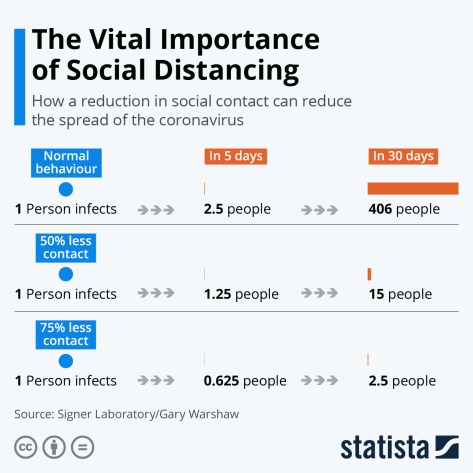


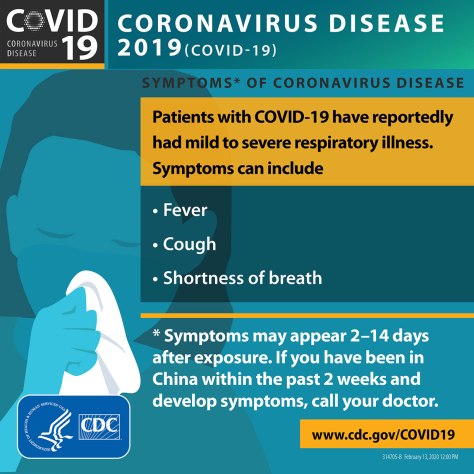
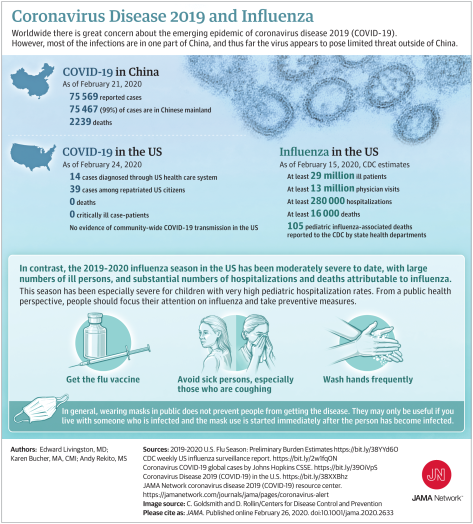
 In public health, honesty is worth a lot more than hope. It has become clear in the past week that the new viral disease, covid-19, which struck China at the start of December will spread around the world. Many governments have been signalling that they will stop the disease. Instead, they need to start preparing people for the onslaught