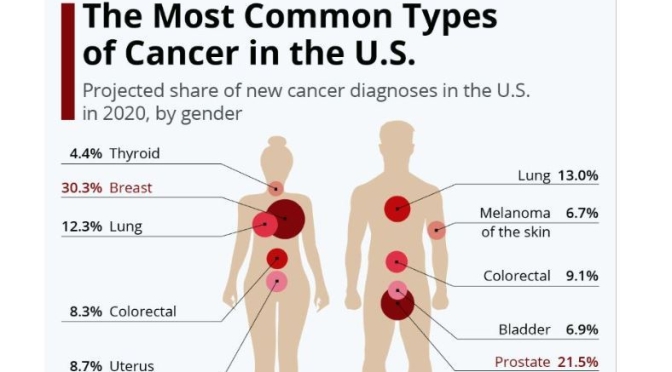

Infographic: ‘The Most Common Types Of Cancer’


![]() It is impossible to ignore the ongoing impact the Covid-19 pandemic is having on our lives. This month our infographic shows how some aspects of daily life have changed as a result. The widespread closure of schools, for example, is thought to have affected up to 1.38 billion learners as of late March. Meanwhile, the sudden shift to remote working is one such change expected to have long-lasting effects. Following the pandemic, 68% of Germans have stated they would like to work remotely more often.
It is impossible to ignore the ongoing impact the Covid-19 pandemic is having on our lives. This month our infographic shows how some aspects of daily life have changed as a result. The widespread closure of schools, for example, is thought to have affected up to 1.38 billion learners as of late March. Meanwhile, the sudden shift to remote working is one such change expected to have long-lasting effects. Following the pandemic, 68% of Germans have stated they would like to work remotely more often.
Our designer Raphael Hammer has created an isometric-style illustration, with each topic area allocated its own quarter of the infographic. Each topic is then afforded its own principle colour and corresponding design details. The almost monochrome effect of the illustrations allows them to perfectly complement the data presented. Especially effective, are the subtle movements which bring the entire graphic to life.
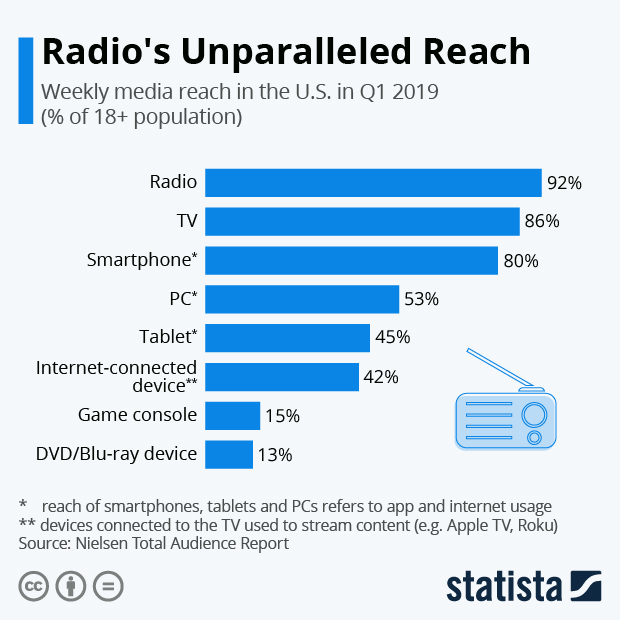
With all the talk about digital media, it’s easy to forget how powerful traditional media such as radio and television still are. Radio in particular rarely gets credited for what it still is: a true mass medium. According to Nielsen, radio even trumps TV in terms of its weekly reach.
According to Nielsen’s measurements, far more than 200 million Americans aged 18 and older listen to the radio at least once a week, equaling a reach of 92 percent of the adult population. Television came in a close second with a weekly reach of 86 percent, while 80 percent of U.S. adults now use apps or browse the web on a smartphone in any given week.
While radio does win in terms of sheer reach, TV remains unparalleled with respect to average daily usage. According to Nielsen’s measurements, U.S. adults spend an average of 4 hours and 27 minutes a day watching TV (live and time-shifted), which is more than 2.5 times the amount of time they listen to the radio (1h 42m).